OPTOELECTRONIC APPLICATIONS: INDUSTRIAL SPECTROSCOPY - Optical instruments keep food fresher… and more honest

Checking the expiration dates and ingredient lists on packaged foods has become second nature for most consumers browsing the aisles of the local grocery store. We all want to be sure that the products we are buying are fresh, maybe organic, and, if possible, devoid of trans fats and too many carbohydrates or calories. Sometimes we even want to know where certain items—such as produce, chocolate, coffee, or cheese—originated in order to take advantage of the expertise of a particular region or country. In fact, the increasingly global nature of the food industry-coupled with several recent instances of tainted food products being recalled due to illness and even death following consumption of these products-has turned food analysis and food safety into a multibillion-dollar business.1
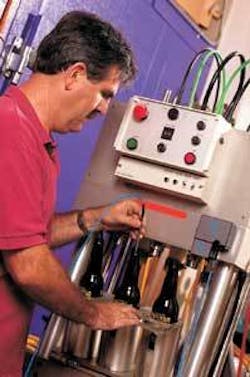
Traditional food-monitoring methods include high-performance liquid chromatography, gas chromatography, graphite furnace atomic-absorption spectroscopy, and inductively coupled plasma optical-emission spectroscopy. But the increasingly complex demands being placed on food analysts to detect more elements in less time with better accuracy and precision have opened the door for mass spectrometry and near-infrared (NIR) spectroscopy as well. Optical instrumentation from a number of companies—including Bruker, Agilent, Ocean Optics, Andor, Jobin Yvon Horiba, Aspectrics, WITec, and Applied Biosystems—are used not just in lab settings but in the field and on production and distribution lines to assess the quality or determine the origin of food products ranging from milk, cheese, and eggs to meat, poultry, fish, fruit, vegetables, coffee, rice, wheat, and honey. These systems are also becoming more common in laboratory and production settings to analyze fat, lactose, and protein levels in dairy products, determine the freshness of eggs and egg products, and monitor bacteria growth in meat products. Other applications include determining when a batch of beer or barrel of wine is ready for consumption, anticipating the optimum harvest time for fruit or vegetables, even overseeing fertilizer requirements for wheat crops grown for cereal and bread (see Fig. 1).
Global market
Three main areas of concern are driving the growing use of optical instruments in food analysis, according to Ian Sanders, executive vice president of Bruker Daltonics (Billerica, MA): what’s in it (expected content), where does it come from (place of origin), and is it safe? The safety category can be further broken down into chemical and microbiological agents, he adds-that is, is the culprit a bug or a pesticide? Ensuring the integrity of raw food materials, ingredients, and end products is both a quality and a regulatory-compliance concern; food suppliers and manufacturers can suffer economic and legal damages if they are found to be supplying incorrectly labeled products.
“Some of this is due to globalization,” Sanders said. “With the point of origin, for example, is the orange you are buying from California or China, and is it mislabeled? By measuring the natural metabolites, you can determine this pretty easily. The other thing is contamination; Japan and the United States, for example, have put in place a number of regulations to test the fruits, vegetables, and food supplements they import. This is being done by government agencies and also food companies that are purchasing large amounts of raw material. We are even starting to see some suggestions that large supermarkets are thinking about doing it to help them properly label their food products, control their supply chain, and avoid lawsuits. These instruments cost $150,000 to $200,000, so this is clearly a serious issue-otherwise no one would be doing it.”
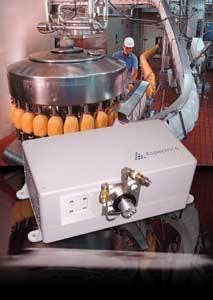
Optical instruments are used throughout the “food chain” to determine, for example, how much lactose is in milk or cheese, how much fat (and what kind) is in a chicken breast or turkey leg, and how much sugar is in that “organic” peanut butter. This information is important for labeling reasons, especially given that emulsifiers, stabilizers, carbohydrates, and thickeners are commonly used to optimize the texture and flavor of food. Aspectrics (Pleasanton, CA), for example, offers an encoded-photometric NIR (EP-NIR) spectrometer that can analyze food for safety and labeling purposes. Whereas traditional NIR systems typically stop at 2100 nm because of limitations of fiber optics, the company’s MultiComponent 2750 analyzer covers the spectral range of 1375 to 2750 nm, making it ideal for analyzing edible oils, protein, fat, alcohols, and starch (see Fig. 2). Aspectrics recently demonstrated the ability of the MultiComponent 2750—coupled to an external halogen NIR source and a 2 mm multimode fiber probe—to quantify the percentage volume of corn, canola, and olive oils in mixtures containing all three oils.“EP-NIR was never meant to be a lab product,” said Bertrand Lanher, director of applied science and technologies at Aspectrics. “It was designed and built for ‘rough’ environments and has been tested and qualified in military environments for vibration. So it is a much more cost-effective system to integrate into the process line. In addition, because the MC2750 goes out to 2750 nm, we are discovering the recombination band (2150-2500 nm), which yields a wealth of information not offered by other NIR spectrometers.”
Bruker offers mass spectrometers as well as optical instruments for food analysis. The company’s accurate-mass liquid-chromatography/mass-spectrometry (LC/MS) products—such as the micrOTOF and micrOTOF-Q ESI-TOF (time of flight) mass spectrometers—are designed to enable users to automatically create their own application-specific accurate-mass libraries for, say, pesticides in food or to determine country of origin through the measurement and classification of metabolites. Other Bruker products are geared toward the detection of bacteria in food products. Last year the company’s optics division introduced the MALDI Biotyper, an 18 × 18 in. benchtop system that uses a 337 nm nitrogen laser and sells for between $150,000 and $200,000.
“Bacteria in food is a big issue,” Sanders said. “Several chocolate companies last year had to recall their products because of bacteria. The challenge with chocolate is that you can’t heat it to kill the bacteria, so when you make it the quality control has to be spot on and you need to know exactly which bacteria is in it. You can’t expect food to be completely sterile but you have to make sure there are no nasty bacteria, so you have to find a way to determine bacterial type.”
The conventional method for detecting bacteria is to take a swab of the sample, put it in a dish, grow it for a week, and then observe it. But with perishable food a seven-day test is inconvenient, at best. With the BioTyper, the swab is placed in a laser TOF machine to quickly determine the chemical matrix and get a fingerprint of the proteins within the bacterial cell. In contrast to other approaches, the BioTyper does not require an initial assessment such as gram staining, oxidase test of unknown samples, choice of PCR primers, or selective growth media.
“People have tried MALDI-type bacteria analysis before, but our particular experience with laser TOF allows sensitive analysis of larger proteins,” Sanders said. “In the past they were looking at smaller proteins and metabolites, which are not very different between bacteria. But the large proteins are. When a bacteria gets on a piece of cheese or meat, the smaller proteins are indicative of what it is feeding on, while the larger ones are indicative of its native proteins.”
Beyond bacteria
Beyond point of origin, ingredient, and safety issues, there are other food-analysis applications for spectroscopy. According to Jason Eichenholz, vice president of research and technology at Ocean Optics (Dunedin, FL), optical instruments are already being used in the field and on production lines to improve the taste and appearance of food by measuring, say, the sugar content of onions, citrus, and other fruits and vegetables; this data can help growers determine the ripeness, predict when the fruit will be optimum for use, and do yield and crop analysis to pick the right fruit at the right time-all of which increases revenues and yields significant savings by optimizing both the product and the process.
Ocean Optics is taking a modular approach to instrument design that it believes will make spectrometers compact and portable enough for field- and production-based food-analysis and food-safety applications. The company’s Jaz platform, launched in January 2007, integrates its new spectrometer, fluorescence measurement and light source modules with a powerful microprocessor and an OLED display (see www.laserfocusworld.com/articles/302470). The Jaz instruments utilize combinations of optical and computer modules (depending on the intended application) configured in a stacked formation. The system currently features ultraviolet-enhanced and visible silicon detectors, but Ocean Optics is migrating to a near-IR bench to give customers interested in this wavelength region the same functionality and adaptability.
“A lot of what we are seeing in this field is in the visible spectrum, such as the presence of sugars in wine,” Eichenholz said. “By looking at the quality of the grape while it is still on the vine, this technology can help the grower pick the optimum products for each variety and thus batch the wine. We can also measure the ratios of different sugars produced in fermentation, which relates to different flavor profiles. That’s significant for vintners in grading and pricing their wines.”
Another element of interest in the food industry, particularly for prolonging the shelf-life of perishables, is modified atmospheric packaging (MAP). In response to this, Ocean Optics has developed the RedEye patch (a tiny sol-gel matrix sensor that can be placed inside a package) and the FOXY fiber-optic probe to monitor oxygen content of a food product on a production line, in a delivery truck, on a supermarket shelf, or at a restaurant. According to Eichenholz, being able to directly and quantitatively measure the oxygen concentration inside a food container after it has been sealed enables a whole new set of applications for MAP. The sensors utilize doped ruthenium compounds whose fluorescence is quenched by the presence of oxygen; the probes are illuminated by 450 nm light from an LED, and the fluorescence in the 600 nm region provides information about the oxygen concentration.
“There is a whole element in food packaging that has to do with the role of oxygen and carbon dioxide in that environment, especially measuring it once you’ve sealed a package,” Eichenholz said. “For example, high-oxygen-concentration MAP is ideal for food products such as fresh fruits and vegetables or red meat, because the oxygen in the package will continue to support the respiration of the produce or combine with the myoglobin in the meat to give a red color. However, foods such as nuts or potatoes require significantly reduced oxygen levels. We are using visible spectroscopic techniques to indirectly and optically measure the oxygen content of a product, even in a liquid environment such as wine.”
REFERENCE
1. A. Martin, G. Palmer, “China Not Sole Source of Dubious Food,” New York Times, July 12, 2007.
About the Author
Kathy Kincade
Contributing Editor
Kathy Kincade is the founding editor of BioOptics World and a veteran reporter on optical technologies for biomedicine. She also served as the editor-in-chief of DrBicuspid.com, a web portal for dental professionals.
