PRODUCT FOCUS: OPTICAL TIME DOMAIN REFLECTOMETERS: What to know when selecting an OTDR
Optical time-domain reflectometers (OTDRs) are commonly used as troubleshooting devices to characterize the loss and length of optical fiber in manufacturing, warehousing, installation, and maintenance. They range in size from small handheld devices to large desktop instruments, but all are used to measure fiber loss, the loss and reflectance of fiber splices, and to locate loss irregularities within the fiber. Although OTDRs are a mature product, manufacturers continue to introduce iterative changes to existing product lines to add new capabilities, improve measurement performance, or increase technician productivity. We consulted with various OTDR manufacturers to get their input on the latest in OTDR technology and their opinion of the key features to consider when selecting an OTDR.
The primary optical components in an OTDR are a pulsed laser, a bidirectional coupler, and a detector, typically an avalanche photodiode. The laser is connected to one leg of the coupler, which is connected to the fiber under test. As the laser pulse travels down the fiber, a small fraction of its light is scattered by the fiber and any other reflective events back toward the laser/coupler. The backscattered light of many pulses is measured over time and plotted as a function of distance along the fiber. This plot, generally a downward sloping line, displays the intrinsic fiber attenuation in units of dB/km at the wavelength of the laser (see Fig. 1). Sudden spikes on the line indicate reflective features in the fiber, while discrete downward steps indicate nonreflective point defects. An OTDR test can take anywhere from a few seconds to three minutes.
Proper acquisition and interpretation of OTDR traces require a trained, experienced technician. The user is responsible for setting parameters such as index of refraction, pulse duration, acquisition time or averaging time, wavelength to be tested, distance range, and helix factor (fiber length versus cable sheath length), says Mario Simard, senior product manager for OTDRs at EXFO (Quebec City, QC, Canada). The technician is also tasked with the challenge of correctly evaluating the automated OTDR analysis, which does not always detect small or closely spaced fiber defects.
A reputable manufacturer expects to consult with customers to help them find the right OTDR. Their first question will be about the application, which generally points to one of two market segments in OTDRs: production and lab (P&L), or the field market segment. Some manufacturers of OTDRs focus primarily on the production/lab side of fiber and cable manufacturing, like Photon Kinetics (Beaverton, OR), and some focus on installation and maintenance or field applications like EXFO.
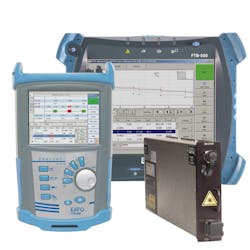
Gregory Lietaert, product line manager at JDSU Fiberoptics Division (Germantown, MD), says JDSU’s focus is primarily field applications, or modular handheld OTDRs, but some users apply field OTDRs in production/lab applications because they are conveniently portable and the price is lower, starting at a price point around $4000 (see Fig. 2). So why is there a market for bulky, more expensive OTDRs? “The higher-end P&L instruments, which start at around $12,000 [at JDSU] are more flexible, can be controlled remotely, and can be integrated into a complex testing platform involving the factory data network,” says Lietaert.
Dave Kritler, marketing manager, Photon Kinetics, adds, “In fiber and cable production, high performance is more critical, so the OTDRs in that segment are focused on high-speed data acquisition and data quality. Fiber and cable manufacturers may measure hundreds or even thousands of fibers a day so measurement time is critical. They also need to make accurate measurements and identify every fiber defect or nonlinearity to ensure customer satisfaction and network integrity.” (See Fig. 3.)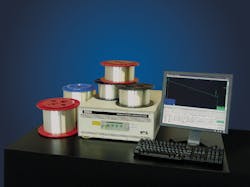
Application categories may be binned according to fiber length. Photon Kinetics offers two versions of a P&L OTDR: one optimized for testing production lengths of bare fiber in the range of 12.5 to 50 km, and the other optimized for testing typical cabled fiber lengths from 0.5 to approximately 10 km. An alternative is to bin OTDRs according to dynamic range (the total loss of the link being measured) in decibels. For example, JDSU’s very-long-haul OTDRs work in the 50 dB range on one end, while their wireless backhaul application has a dynamic range up to 32 dB.
“We prefer to talk about dynamic range rather than distance because it says more about the total loss of the link,” says Lietaert. “The reach of the JDSU OTDR depends on the loss of the fiber itself and its links. Because dynamic range is specified in dB, I ask the customer to estimate the max total loss of the network or link they are measuring. Knowing the fiber distance and fiber attenuation, the number of splices, connectors, and other elements, you can estimate the total loss.”
Key specs
Beyond the wavelength and application, the most challenging specifications for buyers to weigh are the measurement (dynamic) range and the dead zone (resolution) of the instrument. These two specs involve a tradeoff.
Dynamic range specifies the total optical loss that the OTDR can analyze. The higher the dynamic range, the longer fiber distance the OTDR can analyze. “Manufacturers specify dynamic range in different ways, playing with specifications like pulsewidth, signal-to-noise ratio, and averaging time,” says Mario Simard at EXFO. This means an “apples-to-apples” comparison of OTDR manufacturers can be challenging.
“A good rule of thumb is to choose an OTDR whose dynamic range is 5 to 8 dB higher than the maximum loss the OTDR will encounter,” continues Simard. “For example, a single-mode OTDR with a dynamic range of 35 dB has a usable dynamic range of around 30 dB. Assuming typical fiber attenuation of 0.20 dB/km at 1550 nm and splices every 2 km (loss of 0.1 dB per splice), requires short dead zones of 2 to 3 m. The design of the OTDR and the quality of its optics and electronics help minimize the size of the dead zone.
Dead zones may be specified as event dead zones or attenuation dead zones, says Simard. The event dead zone refers to the minimum distance required for consecutive reflective events to be resolved or differentiated from each other. Industry standard values range from 0.8 to 5 m for this specification. Attenuation dead zone refers to the minimum distance required, after a reflective event, for the OTDR to measure a reflective or nonreflective event loss. To measure short links and to characterize or find faults in patch cords and leads, the shortest possible attenuation dead zone is best: Standard values range from 3 to 10 m.
“Specifying dynamic range and dead zone is tricky for manufacturers,” says Kritler. “They want to portray their OTDRs in the best light. But because of all the different modes of operation of today’s OTDRs, what is often specified in a specification table is the best-case performance of two different OTDR operating modes—the short dead zone obtained with ‘high-resolution’ mode and the long dynamic range achieved with ‘long-haul’ mode. However, because of the range/resolution tradeoff in OTDRs, you cannot get both at the same time. So, when you see both high resolution and high dynamic range in the same table, look carefully at the footnotes.”
Other specifications to consider include the laser wavelengths offered, sampling resolution, the ability to set pass/fail thresholds, report generation capabilities, and laser stability. Sampling resolution is defined as the minimum distance between two consecutive sampling points acquired by the instrument. “This parameter is crucial,” says Simard, “as it defines the ultimate distance accuracy and fault-finding capability of the OTDR. Depending on the selected pulsewidth and distance range, this value could vary from 4 cm to 5 m for high-resolution OTDRs.”
Selecting the right OTDR for your test application requires a firm grasp of the details of the fiber link you are testing and the type of information you want to obtain. Once these have been established, OTDR manufacturers will happily help you find a solution that achieves these objectives at the lowest possible cost.
REFERENCES
1. http://www.exfo.com/en/Library/appnotelist.aspx?Id=2
Editor’s note: The “Product Focus” series is intended to provide a broad overview of the product types discussed. Laser Focus World does not endorse or recommend any of the products mentioned in this article.
About the Author

Valerie Coffey-Rosich
Contributing Editor
Valerie Coffey-Rosich is a freelance science and technology writer and editor and a contributing editor for Laser Focus World; she previously served as an Associate Technical Editor (2000-2003) and a Senior Technical Editor (2007-2008) for Laser Focus World.
Valerie holds a BS in physics from the University of Nevada, Reno, and an MA in astronomy from Boston University. She specializes in editing and writing about optics, photonics, astronomy, and physics in academic, reference, and business-to-business publications. In addition to Laser Focus World, her work has appeared online and in print for clients such as the American Institute of Physics, American Heritage Dictionary, BioPhotonics, Encyclopedia Britannica, EuroPhotonics, the Optical Society of America, Photonics Focus, Photonics Spectra, Sky & Telescope, and many others. She is based in Palm Springs, California.