Dense WDM networks challenge test equipment
Dense WDM networks challenge test equipment
Increasing demand for network bandwidth is pushing related test instruments to new performance limits.
Hale Farley
Only a few short years ago, fiberoptic lines throughout the USA were mostly dark and unused--telecommunications companies were still transmitting predominantly voice over the lines. In the past two years, however, the heavy influx of data and video for transmission over fiber has created quite a challenge for the telecom firms, requiring them to increase bandwidth over the same lines so that two-way transmission is possible over every single fiber in a line.
Earlier this year at the Electronicast (San Mateo, CA) Monterey Conference it was estimated that telecommunications bandwidth demand will increase by a factor of three every year for the next 25 years. Using Moore`s law to the third power, which is double exponential growth, bandwidth demand is expected to increase by a factor of ten within the next two years. A major contributor to this increase is Internet traffic--our desire to see pictures instead of just words is using up all the capacity on major spans of the telecommunications network.
This demand for increased capacity places a great deal of pressure on telecommunications companies because it also increases the potential for expensive errors. Last year, for example, one service outage for a backbone service provider cost $200 million while a similar outage by a regional Bell operating company (RBOC) cost $20 million.
An end to this growth does not appear imminent. Current dense wavelength-division-multiplexed (DWDM) systems deployment by several service providers include channel counts up to 80 in the erbium "C" band. And it is not unrealistic to believe deployment will exceed 256 channels in the near future using optical amplifiers with bandwidths up to 100 nm. In fact, one company reported at Supercomm 1998 (Atlanta, GA) that manufacturing techniques will be available for optical fiber with flat optical loss from 1300 to 1650 nm. Using this fiber, DWDM could reach more than 800 channels with 0.4-nm spacing by the year 2001. At OC-48 (about 2.5 Gbit/s), the data bit rate equates to more than 200 billion bits per second on a single fiber.
Testing challenges
Such demands force both the telecommunications companies and test-equipment manufacturers to operate at higher standards. Dense WDM and ever-increasing channel counts add new constraints on test instruments, including the requirement that they be of the highest quality. Furthermore, test-equipment manufacturers must design instruments that can operate equally well in both field and laboratory. In addition to having superior specifications, field instruments must also be easy to use. The telecommunications industry has reorganized and streamlined its workforce; network managers are currently expected to know more than ever before about their optical network but with fewer service personnel to maintain network performance. Hence measurement technologies with remote capability provide the best answer, especially because today`s field instrument may be tomorrow`s optical network element installed in the fiber plant.
Testing the physical layer in fiberoptic networks is related to the fiber. The biggest testing challenge seems to be network performance monitoring. To meet this challenge, service providers are asking both telecommunications hardware suppliers and test equipment vendors to partner with them for on-going maintenance as well as installation and certification.
For maintenance, network managers are relying on advanced test instruments to determine the health of an optical network at all times. Remote fiber testing can help isolate a fault very quickly during a major interruption, but other tests must check for a minor problem such as with a single wavelength of a DWDM system. Two types of testing in the physical layer are expected to identify minor problems--health of individual channels and checking of active components.
Long-term testing of channel health challenges the network managers because they must look for trends in the parameters that indicate capability to carry the digital traffic. Bit error rate checks, for example, will identify a fault in the fiber plant before results can be reported by physical measurements, but an accumulated history of these measurements can indicate the likelihood of a possible service interruption.
Physical parameters to be monitored include optical channel spacing, optical power level, optical signal to noise ratio, gain, gain tilt--flatness of optical amplifier gain as a function of optical frequency--and the deviation from the reference recorded at installation and certification. This performance monitoring must be done without interfering with traffic or affecting the power/loss budget.
The second type of testing is trouble-shooting faults in the fiber plant. A portable instrument that can be transported to a remote site must be able to measure many of the same physical parameters listed above. Because the technician at a remote site may not have the technical expertise to identify and repair faults, remote control from a central office is highly desirable. This places the technical burden on the central office, which has responsibility for maintaining the fiber plant, and field instruments with "virtual remote" interfaces increase the value of these products greatly.
Keeping pace
Standards organizations such as the Telecommunication Industrial Association (TIA) and the International Trade Union Telecommunication (ITU-T) attempt to write procedures that aid all parties--telecommunications equipment suppliers, service providers, and instrumentation manufacturers. The organizations are forced to provide these procedures quickly in order to meet the rapid-deployment demands of service providers who must satisfy the need for additional data bandwidth. To this end, both organizations recently agreed to 50-GHz (0.4-nm) DWDM channel spacing, and several equipment suppliers are already deploying these systems.
One source of concern over this new channel spacing is the supervisory, or telemetry, wavelength. The existing standard is 1510 nm, but there are systems in the fiber plant with 1480- and 1625-nm supervisory wavelengths. In order for the service provider to be independent of equipment manufacturing, a common understanding on in-operability must be reached.
Maintaining channel spacing of 0.4, 0.8, and 1.6 nm presents the largest challenge for the equipment vendors, service providers, and instrumentation suppliers. One way to meet this challenge is to use an optical spectrum analyzer (OSA) during installation and certification. Some OSAs can measure wavelengths from 1450 to 1650 nm with a dynamic range greater than 70 dB. These instruments also may have a diffraction grating with a double-pass monochrometer--a technology that meets the demands of DWDM systems with channel spacing down to 0.4 nm.
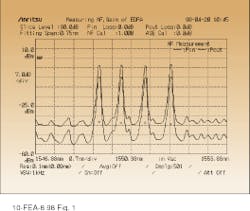
Application firmware permits these OSAs to measure the physical param eters required for installation and maintenance of the fiber plant. These param eters include channel spacing, optical power level, gain flatness, optical signal-to-noise ratio, and others to analyze the DWDM spectrum (see Fig. 1).
Many OSAs also incorporate a built-in super luminescence diode reference light source that allows measurement of other fiber plant parameters such as reflectivity, directivity, and isolation. Many service providers expect to have the ability to monitor more than 120 channels of DWDM, with more than 250 channels deployed in the near future. In order to protect the service providers` investment, test manufacturers have made firmware upgrades available.
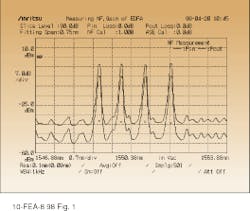
Dense WDM systems include both active and passive elements (see Fig. 2). Erbium-doped fiber amplifiers (EDFAs) generate a high level of amplified spontaneous emission (ASE) noise that makes it difficult to measure the true gain of the device. A pulse technique used with an external modulator is integrated with the OSA and can overcome the ASE noise problem. The purpose of the modulator is to optically switch the signal at a rate faster than the metastable state of the optical amplifier can react (so the amplifier does not react to the pulse), yet slow enough to allow the optical measurement. This technique stabilizes noise and is better suited for DWDM testing than the traditional fitting technique.
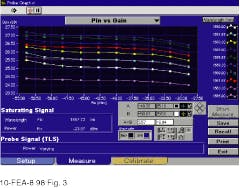
With the pulse-measuring technique, ASE levels at the signal wavelength can be measured directly to produce an excellent modulator on/off extinction ratio. This eliminates discrepancies between fitted curve and actual noise--common problems when using the fitting technique. Because the ASE level is accurately measured, polarization dependence and input loss are optimized and reliability assured. As a result, the small difference between wavelengths of multiple signals found in DWDM systems can be measured. These measurements are channel-count independent (see Fig. 3).
Some instruments also feature three memories and three traces. In addition to using these facilities for additional analyses, such as reflection attenuation, insertion loss, isolation, polarization mode dispersion, and EDFA noise figure/gain, the extra memory allows the OSA to be used as a field instrument, which is especially important in today`s applications.
Typically, the third memory is for field use because it can store data for maintenance testing. With RS-232C and/or IEEE 488 interfaces, the instrument can be controlled remotely from a central office, where an experienced technician can monitor several lines and dictate repair procedures to less-experienced field technicians. o
FIGURE 1. Measurement of erbium-doped fiber amplifier gain compares the noise figure for power in (Pin) and power out (Pout) for four channels at 100 GHz spacing.
FIGURE 2. Dense wavelength-division multiplexing systems include active and passive components.
FIGURE 3. Relationship between Pin and gain at several wavelengths is one of many tests used to fully characterize an erbium-doped fiber amplifier (EDFA) in both laboratory and the fiber plant. Graph shows results of testing an EDFA using a pulse-probe method with an optical switch to make a good measurement of amplified spontaneous emission noise.


