Multispectral scattering measures fruit texture
RENFU LU and YANKUN PENG
Firmness is an important textural property for a wide range of raw (unprocessed) and processed solid foods and is an important quality parameter in grading many horticultural products such as apples, cucumbers, pears, peaches, and watermelons. The current industry-standard technique, the Magness-Taylor (MT) firmness tester, requires penetration of a cylindrical steel probe into fruit flesh for a specified depth. Maximum forces recorded during the penetration are used as a measure of fruit firmness. Because of its destructive nature, the MT firmness tester is only suitable for inspecting selected samples.
Researchers have investigated different methods for nondestructive sensing of food products.1, 2 The majority of past research on firmness measurement has been focused on mechanical methods such as quasi-static force/deformation, vibration, impact, and acoustics. These nondestructive mechanical methods, especially impact and acoustics, are useful for measuring the firmness of some horticultural products. However, they still do not correlate consistently with destructive measurement, and results often vary greatly for different types of fruit.
Now, a new method based on light scattering at multiple wavelengths is being applied to the measurement of fruit firmness—a liquid-crystal tunable-filter (LCTF)-based multispectral imaging system.3, 4 When a light beam is incident upon a piece of fruit, the majority of the light penetrates into the fruit tissue. Upon entering the tissue, photons scatter in different directions: some are absorbed, some pass through the whole fruit and emerge from the opposite side, and some scatter back and reemerge from the region adjacent to the incident center. While absorption is related to certain chemical constituents of the fruit, scattering is influenced by the density, composition, cells, and intercellular structures of the fruit and therefore can be useful for measuring fruit texture.
The imaging system
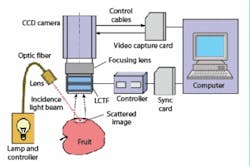
A compact laboratory multispectral imaging system can be easily assembled from a near-infrared enhanced 8-bit black/white CCD camera, an LCTF, a broadband light beam from a quartz tungsten halogen lamp light source, and a computer (see Fig. 1). As the light beam hits the fruit, it generates a backscattering image at the surface of the fruit. The LCTF is electronically tuned for rapid selection of any wavelength in the visible and near-IR range between 650 and 1000 nm with a bandwidth of 10 nm. As the LCTF is tuned, scattering images at individual wavelengths are acquired in sequence from an area 30 mm in diameter with the incident point as the center on the surface of the fruit.
Scattering profiles
Each apple is placed onto the sample holder with the stem-axis being horizontal. The camera captures spectral scattering images from the equatorial area of each fruit at intervals of 10 nm from 650 to 1000 nm. On a sample size of 180 each of Red Delicious and Golden Delicious apples, 36 scattering images are acquired for each apple.
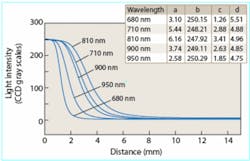
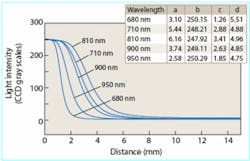
After completion of the imaging of test apples, fruit firmness is measured from the same imaging location by a standard 11-mm MT probe mounted onto a tabletop universal testing machine at a loading rate of 2 mm/s. The MT probe is inserted 9 mm into the fruit tissue and maximum forces are recorded as a reference measure of fruit firmness.Here, I is the light intensity (CCD gray-scale values) when averaging all pixels within each circular band; x is the distance; a is the asymptotic value of light intensity when x approaches infinity; b is the peak value of estimated light intensity at the saturation center; c is the full scattering width that produces the half-maximal peak value (full-width half-maximum); and d is related to the slope.
Nonlinear regression is performed on fitting the MLD to scattering profiles as a function of scattering distance from the beam center. Modified Lorentzian distribution parameters at individual wavelengths are determined for all apple samples when the nonlinear regression process yields the highest correlation coefficient and the lowest standard error of estimate. As a result, four parameter spectra are generated, covering the range of wavelengths from 650 to 1000 nm.
Fruit firmness predictions
Although 36 scattering profiles are obtained for each apple, many wavelengths are highly intercorrelated or redundant. For this reason, multilinear regression (MLR) and cross-validation analysis are performed to determine the combination of optimal wavelengths for predicting apple fruit firmness.
Samples are randomly divided into two groups: calibration and validation. The MLR is applied to the calibration set to calculate the correlation coefficient and standard-error (SEC) values between MT firmness and MLD parameters for each wavelength. The best single wavelength that has the highest r value (or the lowest SEC) is first selected. The search for the best two wavelengths is then started. Individual wavelengths are sequentially added to the best single wavelength, and the corresponding r and SEC values are calculated for all two-wavelength combinations. The best two wavelengths are determined from the combination that gives the highest r and lowest SEC among all two-wavelength combinations. This process is repeated until the calibration model with all 36 wavelengths is obtained.
Then, the cross-validation method (leave-one-out) is applied to the calibration set, starting from the best single wavelength. Each time one sample is taken out from the calibration set, a calibration model is established for the remaining samples and the model is then used to predict the sample left out. Next, the sample is placed back into the calibration set and a second sample is taken out. The procedure is repeated until all samples have been left out once. The correlation coefficient and the standard error of cross-validation (SECV) are calculated for each of the 36 combinations and the combination of wavelengths that gives the least SECV is selected to be the optimal combination of wavelengths. Finally, a prediction model with the optimal wavelengths is established by the MLR method for all calibration samples, and is used to predict the validation set of apples.The MT firmness and predicted firmness for the validation samples of Red Delicious are well correlated with r = 0.82 and the standard error of validation (SEV) equals 6.64 N. Similar firmness predictions were obtained for Golden Delicious (r = 0.81 and SEV = 6.58 N). These prediction results compare favorably with reported results from mechanical methods (r ranges between 0.43 and 0.85).5, 6
Multispectral scattering is nondestructive and relatively easy to implement for online sorting/grading applications. A prototype with a laser-based multispectral imaging system has been built for real-time sensing of apple fruit firmness. While the research has been primarily focused on fruit, multispectral scattering should have potential for evaluating the texture of other foods and nonfood products.
REFERENCES
1. J. A. Abbott et al., Horticultural Rev., 20, 1 (1997).
2. R. Lu and J. A. Abbott, Ch. 5, Force/deformation techniques for Measuring Texture in Food, 2: Solid foods (ed. by D. Kilcast), CRC Press, Woodhead Publishing Ltd., Cambridge, England, 109 (2004).
3. R. Lu, Postharvest Biol. Tech. 31, 147 (2004).
4. Y. Peng and R. Lu, Proc. SPIE 5587, 91 (2004).
5. Y-C. Hung et al., Ch. 7, Firmness-measurement Methods in Nondestructive Food Evaluation (ed. S. Gunasekaran), Marcel Dekker, Inc., N.Y., 243 (2001).
6. I. Shmulevich et al., Postharvest Biol. Tech. 29, 287 (2003).
RENFU LU is an agricultural engineer and lead scientist with the U.S. Department of Agriculture Agricultural Research Service (USDA/ARS) and YANKUN PENG is a visiting assistant professor with the Department of Biosystems and Agricultural Engineering, both at 224 Farrall Hall, Michigan State University, East Lansing, MI 48824; e-mail: [email protected].


