Sharpening the tools of threat detection
The drudgery of long lines at airport security checkpoints continues to complicate schedules and influence the travel plans of millions of people who travel by air. The problem? Metal detectors. The alarms are set off by all metals and by any metal object on the person being scanned. False alarms, rescanning, and divesting items such as keys, coins, belts, and shoes cause significant delays. Current detection techniques cannot tell the difference between a gun or a knife and a harmless metal object like a key or belt buckle. This situation often misleads screening personnel and initiates the time-consuming task of a thorough search.
Existing metal detectors use active induction-coil technology that has many shortcomings—including marginal sensitivity—resulting in limited operational ranges and detection dead zones. Though considered mature, the technology remains limited by the physics behind induced electromagnetic fields that attenuate output response as a function of distance. As objects approach background noise levels, they become undetectable when located midpoint in the detection system; consequently, as the detector range of operation is exceeded, false alarms from electronic noise are increased.
null
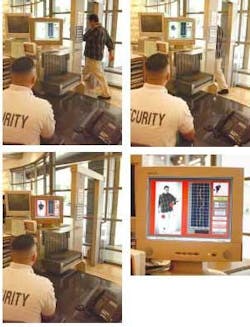
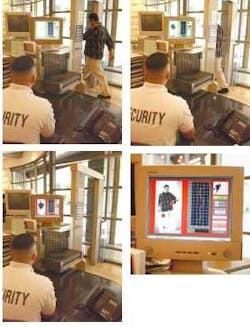
In response to these limitations, View Systems, in cooperation with the U.S. Department of Justice and the Department of Energy's Idaho National Engineering and Environmental Laboratory (INEEL), has designed a walk-through concealed-weapons-detection (CWD) system that is not only capable of detecting weapons, but can also differentiate between threat and nonthreat objects (see Fig. 1). The system uses sensing and imaging hardware and unique software, as well as combinations of neural-net data structures, made practical by the use of a Pentium-based Windows workstation (see Fig. 2). The CWD system is capable of determining the difference between a gun and a cell phone, as well as a variety of weapons among a multitude of other nonthreat objects, with a demonstrated accuracy on the order of 95% to 100%.
null
The CWD technology begins with spatial analysis (x-y axis) software to overlay a series of colored dots onto a live video image of a person walking through a sensor portal. The dots and image appear on a computer screen, which also displays the sensor readings for each dot representing potential threat objects. Recently, researchers have demonstrated the ability to determine whether these potential threats (dots) are on the front, middle, or back of the person (z axis). The ability to define three-dimensional target signatures greatly improves the predictive precision of neural networks and pattern-recognition systems, particularly in schools or other security venues in which backpacks or other parcels are carried through security checkpoints (see "Mathematical rules simplify screening," p. S11).
System architecture
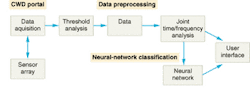
Statistical analysis tools and a variant of a probabilistic neural net (PNN) are used to analyze the spectrum generated when a person passes through a portal. These algorithms analyze multiple variables including variance in the output signature from random weapon placement and/or orientation. The algorithms perform a type of pattern recognition and calculate a probability factor that the collected spectrum signature correlates to a known database of weapon vs. nonweapon responses. Multiple neural networks can be used to further discriminate the type of weapon or item and to, for instance, distinguish cell phones from pagers.
Analyzing the CWD response as a function of both time and frequency, using a digital signal-processing technique called joint time-frequency analysis (JFTA), generates additional unique spectral features. The power spectrum for a given sensor response can then be computed, serving as a fingerprint to aid in signal analysis. The technology may produce major improvements in weapon detection and classification and the ability to discriminate nonthreat items.
Sensor signature analysis
Earlier investigations verified that certain classes of weapons and electronic items, such as pagers and cell phones, produce unique spectral signatures that can be used for automated identification and classification. Most electronic assemblies have sufficient components of interest to generate a CWD sensor response. Even high plastic assemblies such as pagers have unique magnetic signatures.
Other testing has shown that an item's sensed signature is variable and does not behave linearly. The gait and speed of passage, proximity to the center of the portal, and background clutter all affect and alter the sensor's signature. This makes it difficult to reduce the response to a mathematical-based linear algorithm. This research has developed and applied advanced statistical methods for nonlinear empirical pattern recognition and classification of the sensor's signature.
Threshold analysis
The simplest way to reduce false alarms is to ignore events close to the ambient background. A threshold-analysis test is performed to determine whether the detected response exceeds minimum field strength. Alarms representing clutter, such as coins or car keys, are eliminated and not further processed. This commonly used method of discrimination puts the system at risk of not detecting actual threats that can exist in the less-sensitive mid-field regions of the portal. Threshold analysis is only a subset of the signal processing used by the CWD system.
Test results verified that the threat item can be classified by type with a 100% correct classification between the Federal Aviation Administration's operational test piece 0.380-caliber automatic and 0.22 test handguns. Tests also showed that threat items can be discriminated from nonthreat items with a 97.3% correct discrimination factor.
Research also validated the ability to classify a combination of threats when the items are sufficiently spatially separated. However, when items have coupled sensor readings, which occur if they are in close proximity to one another, a complex signature may occur. This interaction can't easily be mathematically modeled, but empirical pattern-classification techniques can help identify the individual targets.
Experiments were performed to verify the ability to detect and identify multiple items. The following items were placed on a subject: a razor blade in the pant pocket, a cell phone on the hip, and a knife in the shoe. The CWD correctly classified the threats in 86% of the test cases.
The raw detector output is processed into reproducible "real-time" data. The data is filtered to remove environmental noise, passed through threshold analysis to discriminate low-level nonthreat alarms, and analyzed in the frequency domain to extract spectral features representative of the potential threat.
PAUL J. REEP is chief operating officer at View Systems, 1100 Wilson Dr., Baltimore, MD 21223; e-mail: [email protected].
Mathematical rules simplify screening
Difficulties facing airport security screeners include people with metal-shank shoes or heels with large metal fasteners. Current metal detectors can also alarm even when an underwire bra is worn. Again, traditional metal detectors cannot tell the difference between these objects and weapons. Combining neural networks, signature analysis, and pattern recognition has allowed system developers to selectively apply these algorithms to discrete points within the x-, y- and z-axes.
Using the underwire bra example, it is not necessary to apply the algorithms for the bra problem if the sensors and spatial analysis software detect the object on the person's back. It would instead apply mathematical rules for weapons that could be located/strapped to a person's back. Similarly, it would not be necessary to spend computer resources applying the rules for a bra in the regions near shoes, where rules for guns, knives, and shoe shanks need to be applied.


