Matched detector and source benefits system sensitivity
There is a golden rule for light-detection instrumentation that is often forgotten—get the signal up. Although reducing the background (another term for unwanted signal) is undoubtedly worthwhile, the best return lies in finding ways to increase the signal. There is a theoretical basis to these statements stemming from the statistical nature of light detection. For those detectors and light sources that obey Poisson statistics (and fortunately for the purpose of this article the majority do), resolution and signal-recovery formulae have the form given in equations 1 and 2 below.
If the measurement derives from the detection of m photoelectrons then the standard deviation on this number is m1/2 with a signal-to-noise ratio (S/N) of:
S/N = m/m1/2 = m1/2 (1)
The performance quality of an instrument, often stated in terms of its resolution capability, improves according to this equation as the square root of the magnitude of the light detected—implying that one has to work disproportionately hard to achieve improved performance. It is also easily shown, by further application of Poisson statistics, that the figure of merit (FOM) relating to instruments in which a wanted signal S per second has to be recovered from an accompanying background B per second is given by:
FOM = S2/B (2)
The argument in favor of increasing S is obviously stronger in equation 2 than in equation 1 because of the S2 dependence, but the instrument designer seeking the optimum performance must aim to achieve improvements in both.
Practical considerations
There are many ways to increase the light signal—by optimizing light collection, for example—but we will highlight what can be gained by matching the detector spectral-response curve to the emission spectrum of the light carrying the signal. The methodology demonstrated in a specific example of light emission from scintillators can be generally applied to any light source characterized by an emission spectrum spanning some wavelength band, such as a light-emitting diode (LED) or an incandescent lamp. Similarly for the detectors, the arguments here referring to the three types of photocathode most commonly used in photomultipliers are equally valid for other types of optical detectors such as avalanche photodiodes (APDs).
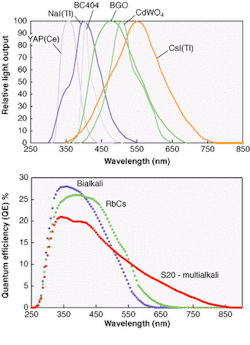
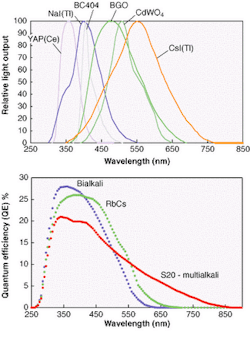
The light-emission spectra of the organic and inorganic scintillators commonly used for nuclear radiation detection are shown in Fig. 1. They are taken from manufacturers' catalogues and are assumed to be typical. Photocathode response curves for the blue-green sensitive bialkali, the green enhanced bialkali, and the S20 (multialkali) from which all scintillation counting applications are met, are given in Fig. 2. These curves are typical of what Electron Tubes and other photomultiplier manufacturers produce. So how does one select the most appropriate photocathode for each scintillator type and what is the expected signal level?
What we seek is the average quantum efficiency (QE) for each photocathode type when viewing the light from a particular scintillator because the higher this number, the better the match. To determine QE we must weight QE(λ), the quantum efficiency at wavelength λ, with the intensity of the light at that wavelength and repeat this at all wavelengths. This is what physicists call folding one function with another and is described mathematically by:
∫QE(λ).S(λ)dλ/∫S(λ)dλ
For computational purposes we can use the discrete form of this, which will provide accuracy greater than the uncertainty inherent in the data that is being used (see equation 3, below).
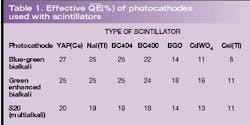
Results have been computed using the data, taken in 5-nm steps and covering the entire wavelength region of interest (see figure, p. 151; Table 1). The scintillators have been entered in the table starting on the left with YAP(Ce) with peak emission in the UV-blue region of the spectrum and ending with CsI(Tl) with emission biased more toward the red end of the spectrum. The bialkali types are the obvious choice when using YAP(Ce), NaI(Tl), and plastic scintillators because these photocathodes have the highest effective QEs for the light emitted. For those scintillators emitting in the green-red region, we see that green enhanced bialkali is the best choice, even for CsI(Tl), although there are still users who specify the S20 photocathode for this purpose—a needlessly expensive option with higher dark current.
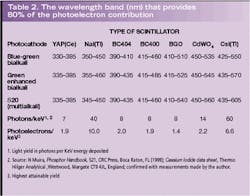
The computation of equation 3 reveals the narrow wavelength region from which 80% of the major contributions to
Cautions
A note of caution is urged in the use of the spectral emission curves assumed for the scintillators in this article. The actual luminosity depends on the batch, the dimensions, the reflectivity of the encapsulation, and on who manufactured the sample. The same caution is urged with regard to the photomultiplier sensitivity curves assumed. In this instance these are truly median catalogue specifications. In really critical low-light-level or high-resolution applications in which every photoelectron is important, the scintillator and the photomultipliers should be ordered to an agreed higher-level specification. Getting the combination right could make all the difference to achieving a successful outcome.
Knowing the spectral content of the source of the incident light is important. Given this information one can then decide which photocathode type will give the best match and hence the highest photoelectron yield. This is particularly important in scintillators with poor light output, such as the plastic range represented by BC400 and BC404 (note BC400 is a general purpose scintillator that emits more light in the green region of the spectrum than BC404, although the latter has a faster decay time). Also with a low light output compared to NaI(Tl) and CsI(Tl) are YAP(Ce), BGO and CdWO4. Historically, manufacturers have quoted the light output of scintillators in terms of anthracene, which was one of the first materials commercially available. Anthracene is little used now primarily because of its low density. Some crystal manufactures prefer to quote luminosity with reference to NaI(Tl) and an S11 photocathode. The problem with this is that the S11 photocathode is obsolete, having been replaced by the green enhanced bialkali, which has a similar spectral response. So the old standard of NaI(Tl) and S11 serves as a reasonable measure of yield, but in the author's view users really need to know the luminosity in direct units of photoelectrons/keV, as has been given in Table 2.
REFERENCE
- Electron Tubes Ltd Photomultiplier Brochure, pmt/02.
TONY WRIGHT is the director of marketing at Electron Tubes, Bury St., Ruislip, HA4 7TA, England; e-mail: [email protected].


