Calibration ensures detector accuracy
Calibration ensures detector accuracy
Understanding the steps involved in the detector-calibration process and its traceability to standards ensures accurate instrumentation to measure fiberoptic components.
Michael Barrett
Accuracy is of paramount concern when considering the purchase of optical-measurement instrumentation. Quite often it is necessary to qualify an outside vendor to ensure that the calibration (accuracy) of the instrument is backed by a sufficient quality system based on industry standards. Optical-power-meter vendors will often simply provide a statement of traceability, but this may be insufficient. Photodiode transfer standards calibrated by the US National Institute of Standards and Technology (NIST; Gaithersburg, MD) allow vendors of optical power meters to realize the detector-based absolute-accuracy scale developed by NIST, providing better transfer standards or parent uncertainties while establishing sound traceability.1
What follows is a brief description of some issues involved in the development of an American National Standards Institute/National Calibration Standards Laboratory (ANSI/NCSL) Z540-1-1994-based quality system for a power-meter spectral-response-calibration facility at ILX Lightwave Inc. (Bozeman, MT), including the calibration process used, and a discussion of uncertainties involved.
Traceability
Calibration is accomplished by comparing the response of a known detector (standard) to the response of the device under test (DUT). The transfer process begins with an absolute, primary standard that is maintained at a national laboratory (see "Following a standard calibration process," p. 130). The high-accuracy cryogenic radiometer is the US primary standard for optical-power measurements. This primary standard is used to calibrate test detectors that in turn become standards for subsequent calibration transfers to other detectors (see Fig. 1).
A calibration is traceable when it can be related to a national standard through an unbroken chain of such comparisons or transfers. Traceability must be complete, that is, the entire system including source wavelengths and photocurrent measurements must be traceable back to NIST.
Self-declaration of traceability is still the norm in the USA. As the international optical-power-meter market matures and customers demand proof of compliance from vendors, self-declaration will no longer be sufficient. Quality system standards have evolved from the traditional MIL-STD-45662A to, most recently, ISO Guide 25, General Requirements for the Competence of Calibration and Testing Laboratories, and ANSI/NCSL Z540-1-1994 (Z540). These standards provide a mechanism for promoting confidence in calibration laboratories when it can be shown that the laboratories are operated in compliance with the requirements of the standards.
Generally, the standards stipulate that all procedures be well documented, including the maintenance and calibration of test and measurement equipment and of measurement standards. They require that calibration facilities use accepted practices and procedures such as the NCSL Recommended Practices.
Though it is not required to do so, ILX Lightwave is attempting to gain accreditation from the NIST National Voluntary Laboratory Accreditation Program (NVLAP)2 in spectral-response calibrations. Accreditation in this program means the laboratory is certifiably compliant with ISO Guide 25, ANSI- Z540, and other NVLA¥technical requirements and is deemed technically competent to perform calibrations and tests in the specified field.
Similar to ISO 9000 registration, NVLA¥accreditation is a comprehensive process including on-site assessments, proficiency tests, and exhaustive reviews of the quality system by appointed experts on the Z540 and experts in the field of calibration. It allows the vendor offering calibration services to expedite qualification processes and may enhance international traceability through mutual-recognition agreements among national standards laboratories.
Accuracy versus uncertainty
ANSI-Z540 stipulates that the calibration data include a stated uncertainty of the measurement made during calibration. The uncertainty of the measurement is the range over which the actual (or true) value of the measurand (optical power) may lie, given the result of a measurement. It is important to distinguish between uncertainty and error. The result of a measurement may be quite close to the actual power and have a very low error; however, the uncertainty prevents that from being known.
NIST offers guidelines for evaluating and expressing spectral-response calibration and measurement uncertainty.3 Accordingly, a certificate of calibration will state the expanded uncertainty. This is the range within which the actual power is asserted to lie with a confidence level of 95%. The particular value of the expanded uncertainty depends on several factors and is different for each product requiring optical calibration. Thus, each type of instrument must be characterized and analyzed to determine its measurement and uncertainty.
NIST guidelines specify two types of measurement uncertainty--Type A is uncertainty evaluated by the statistical analysis of a series of observations, and Type B is evaluation of the uncertainty by means other than statistical analysis of observations. For example, it is acceptable to estimate a contribution to uncertainty if it would be impossible or otherwise impractical to measure and statistically analyze such a measurement result.
Uncertainty sources vary
Uncertainty sources contribute to the measured uncertainty in the calibration of detectors:
Standard detector uncertainty. The photodiodes used for working standards are chosen for their high linearity, stability, and surface uniformity. Currently, the monochromator-based spectral comparator at ILX Lightwave uses two types of detectors for working standards: the Hamamatsu S1337-1010BQ silicon photodetector for use in the 400- to 1000-nm band and the EG&G Judson J16TE2-HSA2-R05M-SC germanium photodiode for use in the 800- to 1700-nm band (see photo on p. 129).
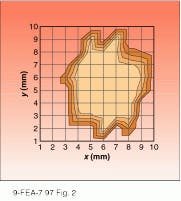
Spatial nonuniformity. The detector responsivity is often a function of where the incident optical radiation strikes it. Figure 2 is a topographical illustration of the response uniformity of a silicon photodiode. The 0.20% contours show areas of relatively uniform response. The spot size used during calibrations is 1.0 mm.
Angular dependence. The angle of incidence of the input radiation also causes the responsivity to vary. As a result, illumination at different angles due to beam tilt or variations in numerical aperture lead to additional uncertainty.
Band-edge shift. Figure 3 shows a typical responsivity curve for germanium. Photodiode detectors change their responsivity with changes in temperature, and the response is especially sensitive to temperature changes when the incident wavelength is near the band edge of 1500 nm. For this reason it is imperative to have high-quality temperature control equipment to stabilize the photodiode temperature.
Detector linearity. The detector responsivity is also a function of the incident optical power. This is most noticeable at high power levels where the detector saturates. Most photodiodes saturate at optical powers greater than 2 to 3 mW. Detector heads with integrating-sphere inputs have an advantage in this instance. In some cases, u¥to 1 W of CW power is easily accommodated through the attenuation characteristics of the sphere.
Photodiode noise. Detectors themselves generate noise. Two of the most common noise sources are Johnson noise and shot noise. Johnson noise dominates when the detectors are used in a zero-biased configuration. The magnitude of noise is proportional to the square root of the detection bandwidth. Thus, higher-bandwidth systems tend to suffer more, in terms of uncertainty, than do low bandwidth systems.
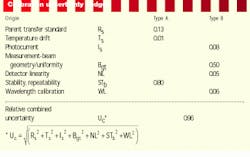
An uncertainty budget is used to calculate the estimated uncertainty in the calibration of, for example, an integrating-sphere-input, visible-wavelength detector head (see table on p. 131). The head uses large-area silicon photodiodes. The relative combined uncertainty Uc is the root-sum-square of the sources. The expanded uncertainty is then 2 ¥ Uc for a 95% confidence level. This is the number that is usually used to determine the uncertainty at reference conditions, that is, conditions approaching those present at calibration, and is the number that is most often quoted in instrument specifications.
Unfortunately, the instrument is often used in conditions somewhat different from reference conditions, and the uncertainty must be expanded to accommodate these conditions. For instance, in fiberoptic applications a significant uncertainty is realized through the use of fiber connectors other than the connector used during calibration.4,5
Informed is forewarned
If accuracy and traceability are concerns when purchasing optical-measurement equipment, look closely at the vendor literature. Call the vendor and ask if there is supporting documentation on uncertainty budgets and calibration procedures and what standards, if any, the quality system complies with.
Beware of self-declarations of compliance without such supporting documentation. Find out more about the National Voluntary Laboratory Accreditation Program, and look for accredited vendors. o
REFERENCES
1. T. C. Larason, S. S. Bruce, and C. L. Cromer, "The NIST High Accuracy Scale for Absolute Spectral Response from 406 nm to 920 nm," US National Institute of Standards and Technology publication (1995).
2. National Voluntary Laboratory Accreditation Program, US Department of Commerce, Gaithersburg, MD.
3. B. N. Taylor and C. Kuyatt, "Guidelines for Evaluating and Expressing the Uncertainty of NIST Measurement results," NIST Technical Note 1297 (Sept. 1994).
4. R. L. Gallawa and X. Li, Appl. Opt. 26(7), (April 1, 1987).
5. I. Vayshenker et al., "Errors Due to Connectors in Fiber Optic Power Meters," a US National Institute of Standards and Technology publication (1996).
Optical-power-meter calibration traceability must be complete; the entire system including source wavelengths and photocurrent measurements must be traceable back to National Institute of Standards and Technology standards.
FIGURE 1. Primary standard is used to calibrate test detectors that in turn become standards for subsequent calibration transfers to other detectors.
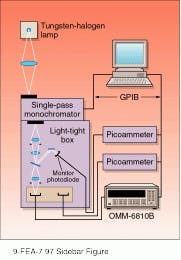
Calibration apparatus is used to assess absolute spectral response to calibrate detector.
FIGURE 2. Response uniformity of silicon photodiode is often a function of where the incident optical radiation strikes it. The 0.20% contours show areas of relatively uniform response. Spot size is 1.0 mm.
FIGURE 3. Typical responsivity curve for germanium shows that responsivity changes with temperature; the response is especially sensitive to temperature changes when the incident wavelength is near the band edge of 1500 nm.
Following a standard calibration process
A monochromator-based spectral-response comparator works well as a calibration system for absolute spectral-response transfer (see figure). The light source is a tungsten-halogen lam¥that emits a continuous spectrum ranging from ultraviolet to infrared. Output from the source is filtered by the monochromator, thus providing wavelength-selectable narrow-bandwidth light. A filter wheel placed at the entrance port of the monochromator prevents undesired wavelengths from entering the system.
The exit slit of the monochromator is imaged at the detector plane through a lens system. A monitor photodiode measures the drift of the source via a beamsplitter. The response current (photocurrent) generated by the detectors is measured with a precision picoammeter, and the data are recorded by a computer. The same computer also controls the monochromator and automates the entire calibration process.
Transferring calibration from the standard detector to the device under test (DUT) is a straightforward process. The monochromator is first set to the desired wavelength, and the standard detector is placed in the system. The photocurrent produced by the standard (in amperes) is
Is = a ¥Rs
where a is the fraction of light transmitted by the beamsplitter, ¥is the power (watts) incident on the beamsplitter, and Rs is the detector responsivity (A/W). The photocurrent produced by the monitor photodiode is
Im1 = (1-a) ¥Rm
where (1-a) is the fraction of light reflected by the beamsplitter, and Rm is the monitor photodiode responsivity (A/W). The monitor photocurrent is indexed, as it may change due to fluctuations in source brightness. Note that the ratio of these currents is independent of the monochromator power and is recorded for later use.
Next, the test detector is placed in the calibration system. In a similar fashion, the ratio of the test detector current It to the monitor current Im2 is also independent of the monochromator power. The responsivity of the DUT is determined by combining these ratios. The standard detector`s responsivity is known (recorded on a NIST calibration report), so Rt is completely determined.
In practice, the standard detector`s response is measured at 10-nm steps over the desired wavelength range, and the quantity Is / Im1 is recorded. Then the test detector`s response is measured at the same wavelengths, and the quantity It / Im2 is recorded. A responsivity data file is created from the ratio information and can be stored in the instrument.
M. B.
