The detection technique of photon counting allows information to be collected from samples that have weak signals or from samples that have time-dependent emissions. Examples of the former include very dilute solutions, such as biological matrices; examples of the latter include studies of fluorescence decay (see Laser Focus World, Oct. 1997, p. 115). A well-known equation credited to Albert Einstein describes the photoelectric effect as E = hn - Eb. This equation simply states that a photon with an energy hn will interact with an atom and eject an electron with energy E if the energy of the photon is greater than the energy binding the electron to the atom Eb. The photoelectric effect is also the principle by which all light detectors operate, and no other detector application better illustrates the photoelectric effect than photon counting.
A single photon interacts with an atom in the detector ejecting a single electron; this is amplified and produces an output pulse that is counted. Although various detectors can be used for photon counting this article concentrates on photomultiplier tubes (PMTs). An understanding of the operation of detectors, the principles of photon counting, and some of its advantages will facilitate increased application of the technique in designing many instruments (see photo above). One variation of the technique, time-correlated photon counting, is especially useful in time-resolved fluorescence spectroscopy and other experiments with modelocked laser sources (see "Time correlation boosts pulse resolution").
What makes a good photon-counting detector? First it must have a good ability to convert light into electrons, expressed as its quantum efficiency. In an ideal detector, one photon would result in the generation of one electron. In reality, some of the photons can pass through the detector without generating any signal. The quantum efficiency expresses the ratio of incident photons to generated electrons. Second, the detector must have internal gain. In other words, it must have the ability to amplify a single incident electron to a level sufficient for detection by external circuitry.
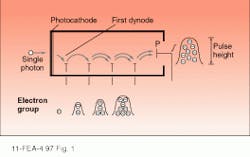
The detector most widely used for photon counting is the photomultiplier tube (see Fig. 1). A PMT consists of a photoemissive surface (the photocathode), secondary electron emission electrodes (the dynodes), and a collection electrode (the anode); all these components are contained in an evacuated bulb. Light passes through a glass window and is absorbed by the photocathode, which in turn generates a photoelectron. This electron is accelerated to the first dynode by an electric field, where it gains enough energy after striking the dynode to emit a number of secondary electrons. This process is repeated for the succeeding dynodes until the signal is collected and output from the anode.The output signal from a PMT takes the form of a current pulse that varies in amplitude and pulsewidth depending on the structure of the PMT. The amplitude of the pulse can be estimated from the following expression:
Ip = (e- × G)/Tw
where Ip = peak output current of the PMT, e- = charge of an electron, G = gain of the PMT, and Tw = the pulsewidth of PMT output. In the normal analog mode of operation these output pulses are integrated and the signal is read as a dc current. Using the photon-counting method, however, the output pulses are actually counted individually.
Principles of photon counting
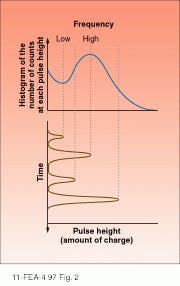
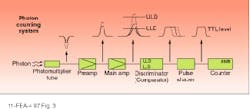
The ideal PMT would output a pulse of the same amplitude for every photon incident on the photocathode. These pulses would then be counted as signal. Because the world is not ideal, the output pulses are subject to a statistical distribution in the number of secondary electrons generated at the dynodes. The effect of this variation is that the amplitude of the output pulse is distributed about a mean value. The distribution follows Poisson statistics. Furthermore the dynodes emit spurious pulses of their own. As a result the output pulse-height distribution (PHD) becomes somewhat complex (see Fig. 2). The PHD is a histogram of the number of counts at each pulse height. The x-axis represents increasing pulse amplitude, while the y-axis represents the number of counts that occur at each pulse amplitude.A typical photon-counting circuit functions as follows: the PMT outputs a current pulse, which is converted to a voltage and amplified by the preamplifier (preamp). The usual gain of the preamp is about 50~100. The pulse then goes to a main amplifier that will further increase its amplitude, but in most systems this stage is not required, as the gain of the preamp is usually sufficient. The next stage is the most important for photon counting—it consists of the discriminator, a digital comparator that will only output a pulse if the input pulse falls within a certain range of amplitudes. This range is determined by the lower-level discriminator (LLD) and the upper-level discriminator (ULD). The LLD removes pulses of low amplitude such as the dynode noise. The ULD removes pulses that are of larger amplitude than the photon pulses. These large-amplitude pulses result from cosmic rays and other sources and are therefore quite rare, so an ULD is almost never used in photon-counting circuits. After passing through the discriminator the pulse proceeds to a pulse shaper to be shaped to the desired logic (TTL or ECL). Finally, the pulse is counted.
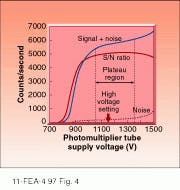
Once the circuit is in hand, the next task is to set the discriminator. Using a pulse-height analyzer makes it easy to generate a PHD curve, and then the discriminator is set at the valley of the PHD. However, few laboratories have these instruments, and instrument designers must follow an empirical approach. The most convenient way is to generate a plateau curve (see Fig. 4) by setting the discriminator to some reasonable value, adjusting the PMT operating voltage to its nominal value, and applying about 100,000 photons per second as a signal. The PMT applied voltage is then reduced until no counts are produced at the counter. The voltage is then incrementally increased, and the signal counts and dark counts are recorded at each voltage step. The resulting graph will show the plateau region for that particular tube and discriminator setting. The proper operating high voltage would be 50-100 V greater than the beginning of the plateau region.Advantages of photon counting
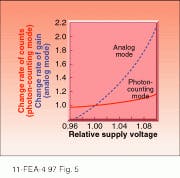
One of the significant advantages that photon counting offers is stability. Because one is concerned only with pulses above a certain amplitude, small fluctuations in that amplitude have very little effect on the stability of the photon-counting system. As a result parameters such as high-voltage stability and temperature stability that would concern an analog circuit designer can be virtually ignored by a photon-counter designer (see Fig. 5).Another benefit of photon counting is an improvement in the signal-to-noise ratio. The primary source of noise in PMTs is the statistical fluctuation in photon arrival rates and in generation of secondary electrons in the dynodes. The former is known as the shot noise and consists of three main components: shot noise of the photogenerated signal of interest, shot noise due to the photogenerated background light, and shot noise resulting from thermally generated signal in the photocathode known as dark current or dark counts.
An ideal detector would consist of only these noise sources. There is, however, a statistical fluctuation in the generation of secondary electrons at the dynodes (as mentioned above); this source of noise is labeled the excess noise factor (F). It is basically the noise added to the signal by the multiplication process of the PMT. With this in mind, simplified versions of the signal-to-noise ratio can be expressed for both the analog and photon-counting modes of operation.
Through a detailed analysis, it is understood that the photon-counting mode provides a better signal-to-noise ratio by a factor F of excess noise. Furthermore, the dark current in the analog mode includes the dark emission from the dynodes, as well as ohmic leakage in the tube structure, while the dark current in the photon-counting mode includes emission only from the photocathode. This difference results from the pulse-height discriminator, which only counts pulses from the photocathode. Therefore the photon-counting mode effectively reduces the dark noise to only photocathode emissions.
Recent improvements in high-speed, low-power electronics has made photon counting an affordable and in many cases a preferable option for instrument designers. Photon counting can cover the signal range of a few photons to more than 107 photons/s, which gives an instrument a wide dynamic range, very good stability, and a superior signal-to-noise ratio. Photon counting is not an option when the light signal level spans a range greater than 107 photons/s. However for instruments that need to push the envelope of sensitivity even lower, photon counting could be the best bet.
Time correlation boosts pulse resolution
A very interesting variation in the photon-counting method is a technique known as time-correlated photon counting (TCPC). This technique is used to measure very fast fluorescence lifetimes, fast laser pulses, and other ultrafast processes. Simply explained, it is a technique by which a laser pulse or fluorescence decay is temporally reconstructed photon by photon.
Most methods of measuring pulse response look directly at the output wave-form of the detector. In this case, one is limited by the response time of the detector in use. In other words if the risetime of the detector is 150 ps one cannot directly resolve a 50-ps pulse. With TCPC, however, a detector with a 150-ps risetime can resolve a 30-ps pulse!
At the heart of the TCPC system is a piece of equipment known as a time-to-amplitude converter (TAC). A high-speed laser pulse is used to excite a fluorescent material. Simultaneously, the laser sends a trigger pulse or start pulse to the TAC. The output voltage of the TAC starts to ramp up at the same time the fluorescent material is outputting a decay pulse to the PMT; before this decay pulse can be detected, it must be optically attenuated until just a single photon enters the PMT. The PMT output pulse goes to a preamp and a discriminator and is converted to a digital pulse, which is then input to the TAC as a stop pulse. The TAC output voltage is a representation of where the photon occurred in time.
This series of events is repeated pulse after pulse until the original decay pulse is reconstructed photon by photon (see figure). For this system to work properly it is critical that there be very little time jitter in the start and stop pulses. Delay in the system is acceptable but variation in the delay is not. In fact it is variation in the PMT electron transit time that limits the temporal resolution of the TCPC method.
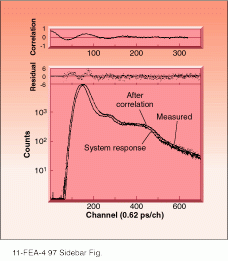 In a time-correlated photon-counting experiment, data are accumulated in various channels with time (as dots). The system response is recorded (lower curve) and then the correlation process results in the fluorescence decay curve, which for this sample of stilbene corresponds to a lifetime of 6.4 ps. Statistical information (residuals and correlation) is displayed above the decay data.
This detection technique has proven to be useful for fluorescence lifetime measurements, studies of high-speed pulsed lasers, and for laser ranging systems. It offers very good temporal resolution and high sensitivity. However, one must have a repetitive light source such as a modelocked laser to reconstruct the pulse. If very good temporal resolution is required with very little signal, TCPC may be the answer.
About the Author
Earl Hergert
VP of Marketing, Hamamatsu
Earl Hergert is VP of Marketing at Hamamatsu (Bridgewater, NJ).

