Morphological operators aid nonlinear filtering of color images
In nonlinear filtering, each pixel in a color image is viewed as a three-dimensional vector. A set of color morphological operations has been developed to order the vector data.
Nonlinear filtering of color images is not as straightforward as nonlinear filtering of grayscale images. In a color image, the intensity value at each pixel location is not represented by a scalar value, but a vector composed of three components, either red, green, and blue (RGB) or hue, saturation, and intensity (HSI). Linear filtering of a color image is the same as filtering a grayscale image because each color component can be treated as a separate grayscale image and filtered independently. Nonlinear filtering of color images, however, requires that the correlation or information common between each color component be included in the filtering process.
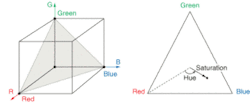
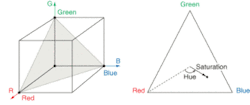
Color images are typically defined in terms of a red, green, and blue component (RGB color model). Each component is represented by a gray level proportional to its intensity and the RGB color space is formed by using the red, green, and blue intensities as the three dimensions of a Cartesian coordinate system. For a 24-bit color image, there are 16.7 million color combinations, which limits the size of the RGB color space to that of a finite-sized cube (see Fig. 1, left).
The main limitation of the RGB color model is that it doesn’t correspond to the human visual interpretation of color. The HSI model is one way of representing the red, green, and blue components in terms of chromatic and achromatic information. The HSI triangle is the plane formed by connecting the red, green, and blue corners of the RGB cube. Under the HSI color model, the rectangular red, green, and blue coordinates are transformed into the polar coordinates of hue and saturation (see Fig. 1, right).
Hue is defined as the angular distance between the reference line connecting the center of the triangle and the color red. Saturation represents how much white is present in a color and is measured as the radial distance from the center of the triangle to the given color point. Low saturation colors (pastels) are located at the center of the triangle while the boundary contains the high saturation colors.
Hence, when applying electronic imaging techniques to a color image it’s important that the hue component be maintained. Changing a green grass of a field to bright blue or changing the blue sky to purple would be quite objectionable. This need to maintain the hue component during image processing is one of the major difficulties associated with using the RGB color model to generate three images that are then processed individually as grayscale images. Iffr(x, y), fg(x, y), and fb (x, y) are the three grayscale images representing the RGB color components of the color image f(x, y), then the linear image operator T operating individually on each component image produces three new color components:
null
or(x, y) = T[fr(x, y)] ,
og(x, y) = T[fg(x, y) ,
and
ob(x, y) = T[fb(x, y) ,
null
where or(x, y), og(x, y), and ob(x, y) are the RGB components of the output image o(x, y).
A linear image-processing operation applied equally to each of the RGB component images does not change the percentage of red, green, or blue, maintaining the hue in the original image. However, a nonlinear filtering operator can change the percentage of each of the RGB components, thus changing the hue of a pixel.
An entire area of nonlinear filtering is based upon order statistics, which requires that the data defined by the filter mask be ordered from its minimum value to its maximum value. The main difficulty in applying order statistics to color images is that there is no clear-cut method of ordering nonscalar data. While each pixel in a grayscale image is represented by a scalar value, each pixel in a color image is represented by a vector. One could base the ordering on the magnitude or phase of each vector, but this is still not a complete ordering of the vector data.
Three techniques can be used to order vector data: marginal ordering (M-ordering), reduced ordering (R-ordering), and conditional ordering (C-ordering). If X represents a p-dimensional vector, X = [X1, X2,...Xp]T represents our input data, with XI representing the ith (unordered) sample and X(i) the ith order statistic. In color image-processing applications, each Xi sample is a color vector within the neighborhood of the operator. With M-ordering, each component is ordered independently. The ith order statistic is X(i) = [X1(i), X2(i),... Xp(i)]T. In contrast to scalar order statistics, the marginal order statistic X(i) may not correspond to any of the original samples.
In R-ordering, a scalar measurement is computed for each sample, and then the samples are ordered according to this measurement. It is important to select an appropriate measurement function. A commonly used metric is the generalized distance to a reference point α using a covariance matrix Γ that represents the reliability or scale of the measurement in each direction:
di = (Xi - α)TΓ−1 (Xi - α)
null
A problem exists in R-ordering when two distinct samples yield the same metric-the ordering of samples with identical metrics is not specified, even though the sample values may be different.
In C-ordering, the samples are ordered using one component initially. In the case where multiple samples have the same initial component value, a secondary component is used to order those samples, and so on. C-ordering places a total ordering on the data and each order statistic corresponds to an original sample. This approach may make sense where a priority can be placed on the components. But this is not the case when dealing with the RGB color space-each component has equal weighting. Hence, the HSI space is typically used with C-ordering.
Color morphological filtering
A new set of color morphological operators was developed that uses a reference color analogous to the maximum gray level in grayscale morphology-color dilation will tend to move toward this reference color, color erosion away from it. The reference color is specified with maximum luminance, maximum saturation, and a variable, user-defined hue-we can then speak of red dilation, blue erosion, or green erosion. A red dilation increases the size and brightness of red objects within the image; blue erosion decreases the size and brightness of blue objects.
Color vectors within the structuring element support are ordered according to their generalized distance to a reference color. Ordering color vectors using the generalized distance measurement is an application of reduced ordering. Each color vector is composed of a single luminance component (Y) and two orthogonal chromatic components (R-Y and B-Y).
Color dilation selects the color vector with minimum distance (that is, closest to the reference color) and color erosion selects the color vector with maximum distance. This definition causes, for example, a dilation using a red reference color to make the image redder. Color artifacts are avoided because the output color vector always corresponds to one of the input color vectors.
It is possible that two or more distinct color vectors within the operator’s window are equidistant from the reference color. To avoid color artifacts, we constrained the operator to select a color vector from the input samples. Because the human visual system is more sensitive to changes in hue than in luminance and saturation the first tie-breaking decision selects the color vector with minimum hue, where the reference color is assigned a hue of zero. Consequently, we have imposed a total ordering on the hue component. It is still possible that two or more distinct color vectors have the same distance metric and the same hue. We chose the next ordering decision to be selection of the color vector with the smallest saturation. If two input color vectors have identical distance metric, hue, and saturation, then the color vector with higher luminance is chosen. Ordering of color vectors is therefore a hybrid of reduced ordering and conditional ordering.
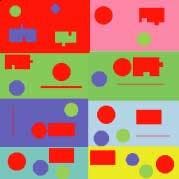
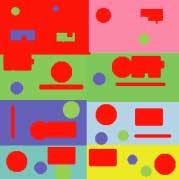
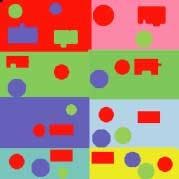
We performed the color morphological operations of dilation and erosion on a synthetic test image using a 5 × 5 psuedo-circular structuring element (see Fig. 2, top). We applied the morphological operators of dilation and erosion to the test image using a red reference. In the red-dilated image, the red objects became larger (see Fig. 2, center). Red objects that are close together were joined, such as the red circle and red rectangle in the center right. Non-red objects on non-red backgrounds also changed size, such as the green and blue circles throughout the image. In the red-erosion result, the narrow red lines were removed (see Fig. 2, bottom). The small connection between the red circle and red rectangle in the center left were broken.
ACKNOWLEDGMENT
This research was performed at the Electrical and Computer Engineering Department at the University of Central Florida, which has an active research program in image processing, from multitransform compression to color image processing. See www.ece.ucf.edu.
BIBLIOGRAPHY
1. R. C. Gonzalez and R. E. Woods, Digital Image Processing, Addison-Wesley, Reading, MA (1992).
2. R. N. Strickland, C. S. Kim, and W. F. McDonnel, Optical Engineering, 26(7), 609 (1987).
3. G. E. Hague, A. R. Weeks, and H. R. Myler, “Histogram Equalization of the Saturation Component for True-Color Images using the C-Y Color Space,” SPIE: San Diego (July 1994).
4. P. E. Trahanias and A. N. Venetsanopoulos, SPIE. 1818, 1396 (1992).
5. P. E. Trahanias and A. N. Venetsanopoulos, IEEE Trans. on Image Processing 2(2) 259 (1993).
6. A. R . Weeks, Fundamentals of Elect. Image Processing, 109, SPIE Press, Piscataway, NJ (1996).
7. P. E. Trahanias and A. N. Venetsanopoulos, Image Processing: Theory and Applications, Elsevier Science Publishers (1993).
8. M. L. Comer. and E. J. Delp, J. Electronic Imaging (April 1999).
9. L. Sartor and A. R. Weeks , J. Electronic Imaging (April, 2001).
ARTHUR R. WEEKS and SAMUEL S. RICHIE are associate professors at the Electrical and Computer Engineering Department, University of Central Florida, P.O. Box 32816, Orlando, FL: e-mail: [email protected]. LLOYD J. SARTOR is a senior engineer at Raytheon, 3801 University Dr., McKinney, Texas 75071.
