Microscopy/Image Processing: A deconvolution revolution for confocal image enhancement
JAMES LOPEZ, SHINTARO FUJII, ATSUSHI DOI, and HIROMI UTSUNOMIYA
Image deconvolution is an image-processing technique designed to remove blur or enhance contrast and resolution. Historically, its application was limited to the enhancement of widefield images and it was considered unnecessary in confocal microscopy. Data provided by deconvolution was considered difficult to interpret and sometimes untrustworthy—however, deconvolution is now considered a powerful and versatile research tool and is often part of a confocal protocol. Now, every major microscope manufacturer promotes the use of deconvolution for enhancing confocal image resolution.
Making effective use of deconvolution, however, requires careful attention to methods and associated artifacts.
Deconvolution and resolution
In microscopy, deconvolution refers to the use of algorithms to enhance the signal-to-noise ratio (SNR) and resolution, typically by reassigning out-of-focus light back to its original position. (The term “resolution” in this context relates to the minimum distance that two objects can be from one another and still be optically distinguishable as individual entities.)
Microscopic image resolution is usually measured as the full-width at half-maximum (FWHM) of the point spread function (PSF), which is a three-dimensional intensity measurement of a small object (such as a 50–100 nm fluorescent bead). It is possible to use the FWHM measurements of PSFs on raw and deconvolved images to measure the effect of the deconvolution processing. Objects are mathematically determined to be separated based on the Rayleigh criterion, the classic method for determining resolution changes. However, the FWHM measurement on a PSF is not the full story for measuring the effect of deconvolution.
Although resolution of a confocal microscopy system is often defined by FWHM, FWHM is different than resolution, especially in relation to processed images. Blur can often be reduced in the observable image as defined by FWHM, but while deconvolution reduces FWHM, improved resolution may not result. The specific method applied for deconvolution and the parameters used for the algorithms greatly impact both measurable FWHMs and total image resolution. And it is worth noting that some methods perform better on small, clearly defined objects such as beads rather than the tangled filaments commonly depicted in cellular images.
In research settings, deconvolution is used for two purposes—to improve image quality and to resolve underlying data obscured by blur. But if deconvolution does not always improve resolution, do we need it?
Because the image produced by a microscopy system represents both the object being imaged and the imaging PSF, it will depict blur around the object. Optical and electronic system noise contributes to the blur, further reducing contrast. Deconvolution mathematically reverses “convolution”—that is, the mixing of PSF and real object with system noise. Thus, it restores to original the objects depicted.
A fundamental question of image processing has emerged: is the raw image real? Or does the deconvolved image better represent the sample? Given the reality of convolution, one could argue that a processed image more closely represents real objects than does a raw image. The addition of detail and improvement in image quality is the reason deconvolution is now commonly used in many imaging modalities.
Through advancing deconvolution algorithms and improved sensitivity in modern imaging systems, scientists are able to produce better microscopy images than ever before. In recent years, deconvolution has overcome barriers associated with long image processing times. Olympus cellSens software implements GPU-based deconvolution, resulting in up to 7X faster processing. Image-restorative algorithms also now produce fewer artifacts, allowing deconvolved images to be far more reliable and representative of samples than they were a decade ago. The results not only look better, they more accurately depict events and structures.
Deconvolution methods
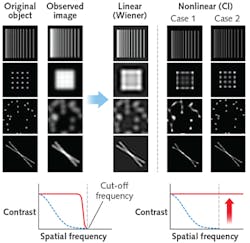
Types of deconvolution include linear, nonlinear, and a combination of the two. Deconvolution methods enhance contrast from small objects detected by the optical system. It is possible to convert an image from the spatial domain to the frequency domain (or spatial frequency) by applying a Fourier transformation. Large objects, which are low-frequency and high-contrast, are easily detected by an optical system, while small objects increase in the frequency domain and typically have reduced contrast. Reducing contrast with increasing spatial frequency, at some point the “cut-off frequency” is met in the frequency domain and the optical system collects no information above this spatial frequency point. In the frequency domain, linear deconvolution involves amplification of contrast only within the cut-off frequency; it will not create higher frequency components above that spatial threshold, and thus is considered reliable.
Linear deconvolution may have very positive effects on image quality if artifacts are minimized. However, linear deconvolution can impart a ringing artifact, meaning that positive and negative intensity oscillations appear outside the imaged object. Ringing can reduce overall image resolution, while individual measurable objects may exhibit reduced FWHM measurements.
The major method of nonlinear deconvolution is an approach that estimates the object by revisiting the result over multiple iterations. This estimate is created by establishing convolution and creating a blur image, and then comparing this to the original. Estimated images with fine structures are produced in a gradual process. Various algorithms (MLE, Fast MLE, Gold, etc.) are available for creating estimated images.
As more iterations are applied, nonlinear deconvolution gradually shrinks the object size by comparing the calculated blur image to the original. For this reason, it is more effective to improve an image’s appearance with nonlinear deconvolution than with linear deconvolution—but image enhancement results depend on structures in the image. And the effect of nonlinear deconvolution cannot be described as a simple reduction in PSF or amplification in spatial frequency, because the original image impacts the resulting deconvolution image.
In nonlinear deconvolution, estimation accuracy depends on object structure. A point can be easy to estimate, but with denser structures, estimation becomes more difficult: Structures will shrink, but resolution may not improve. Components above the cut-off frequency can be created by estimation, and data not captured by the optical system can produce artifacts. With too many estimation iterations, a 100 nm bead can be reduced to 80 nm, resulting in a loss of data.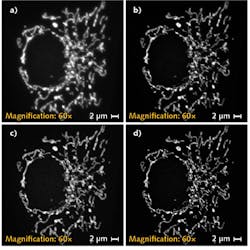
Besides object density, estimation results can also be impacted by factors such as imaging condition and processing parameters such as PSF shape, iteration number, and nonlinear deconvolution mode. Thus, careful consideration is necessary and various values should be tested. The validity of estimation can be judged only by the appearance of the image (see Fig. 1).
Putting knowledge into practice
To summarize, then, linear methods can produce ringing effects that reduce FWHM without improving resolution. And only the components within the cut-off frequency are enhanced. With nonlinear deconvolution methods, image quality improves, but the results are difficult to evaluate. Nonlinear methods may also offer lower reliability because of potential amplification above the cut-off frequency.
In practice, nonlinear methods that dominate the market are great tools for reducing blur in three dimensions as well as reducing noise. Various microscope modalities (including widefield, confocal, spinning disk, superresolution, and two-photon) with corresponding PSFs are also supported (see Figs. 2-5).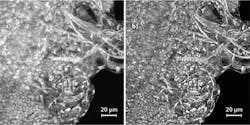
A few tips to keep in mind:
- Weigh the pros and cons of the various deconvolution modes—linear, nonlinear, and combination;
- Deconvolution can be overdone—seek a balance between artifacts and restored resolution;
- FWHM does not equal resolution—it is possible to reduce FWHM and not improve resolution;
- While artifacts occur with all deconvolution methods, they can be minimized; and
- Deconvolution is an excellent tool for improving image quality, as long as the factors above are adequately considered.
James Lopez is manager for life science applications in the Scientific Solutions Group at the Olympus Corporation of the Americas, Waltham, MA; e-mail: [email protected]; www.olympus-lifescience.com, while Shintaro Fujii is with the Optical System Development Division and Atsushi Doi and Hiromi Utsunomiya are with the Scientific Solutions Global Marketing Division, all at Olympus Corporation, Tokyo, Japan; www.olympus-global.com.