MULTISPECTRAL IMAGING/DEEP TISSUE IMAGING: Extended near-infrared: a new window on in vivo bioimaging
DANIEL SALO, DAVID KIM, QIAN CAO, and MIKHAIL Y. BEREZIN
Currently, state-of-the-art deep tissue and in vivo optical imaging is based on endogenous and exogenous optical contrast agents absorbing and/or emitting light in the 700–900 nm region known as the near-infrared (NIR) optical window (see Fig. 1).1,2 Because photons at longer wavelengths penetrate deeper into living tissue,3 the NIR region has been widely utilized in the past decade4,5 and a number of clinical NIR imaging applications have been developed.6,7
Going further than 900 nm into the extended NIR (exNIR) has been difficult, primarily because detectors have not been sensitive enough: Those based on silicon produced low signals and poor signal-to-noise ratio beyond 900 nm. And while detectors based on germanium (Ge), indium antimonide (InSb), and mercury cadmium telluride (HgCdTe) are significantly more sensitive in the exNIR range, they still suffer from low efficiency.
Thankfully, indium gallium arsenide (InGaAs) sensors with their high quantum efficiency in 900–1600 nm have appeared. They are now commonly recognized as the most practical detectors for imaging, mostly in military applications, but the recent development of InGaAs-based diode array detectors and sensitive research cameras has sparked interest among biologists in the relatively unexplored exNIR spectral region also known as "the second NIR window" (900–1400 nm).8,9
exNIR for bio
The obvious advantage of this exNIR region over the NIR in biological imaging is the relative decrease in scattering; Rayleigh scattering of photons in tissue is inversely proportional to the photon's wavelength (I ~λ-4). Attenuation of scattering leads to the increase in transparency of the biological tissue and potentially to the improvement in the depth penetration.
Because the spectral landscape of biological tissue is more complex in exNIR than in NIR, the tissue compositions must be further explained. Hemoglobins are the dominant endogenous absorbers in the NIR range, whereas the exNIR range provides a different set of chromophores. Above 950 nm, relatively strong absorption signals due to water and lipids become important contributors to tissue absorption. Water displays characteristic absorption bands around 970, 1200, and above 1400 nm, while lipids exhibit unique bands at different wavelengths (see Fig. 2). The overall water-lipid-protein spectral profile of the tissue absorption in exNIR is expected to be indicative of the organ type, gender, and age of the tissue, and is considered to be an optical signature of the tissue.Contrast source
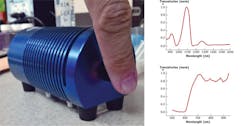
Absorption bands seen in exNIR relate to overtones and combination bands of their corresponding fundamental vibrations (tones). The overtone and combination bands appear significantly blue-shifted with respect to tones. The latter are typically observed at mid-infrared (400–4000 cm-1 or 2500–25000 nm) by IR or Raman spectroscopy. An example of such fundamental vibrations of water is shown in Figure 4. Overtone and combination bands are due to the anharmonicity of the vibration that is the deviation from an ideal harmonic oscillator, such as seen in a bond with two identical atoms. The anharmonicity increases when the bond connects atoms with dramatically different masses, such as in cases of X-H bonds, where X is C, O, S, or N. Because of the anharmonicity of tissue components, the exNIR range is dominated by signals from bonds involving hydrogen atoms such as O-H (water, carbohydrates), C-H (lipids), and N-H (proteins). Being forbidden transitions by vibrational selection rules,10 the intensity of the overtone and combination bands are generally 10–100 times weaker when compared to fundamental vibrations.11The low intensity of absorption from the overtones has led spectroscopists to ignore the exNIR spectral range since the study of this range requires large amounts of the sample. However, low absorption suggests that the exNIR photons are able to penetrate deep into the tissue. This, along with a lack of autofluorescence and attenuated scattering, makes the exNIR spectral range attractive for imaging.
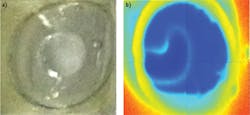
Because tissue-forming components such as water and lipids show different spectra, it is possible to derive an imaging strategy of a tissue based on using two or more characteristic wavelengths. To improve contrast, we used a ratiometric method obtained from multispectral imaging: each image was obtained at a specific wavelength, and the acquired "datacube" was processed to find the best visualization. This approach for the water-fat phantom is illustrated using a suspension of water in corn oil (see Fig. 5): A bubble of water (surrounded by oil phase) was first pictured with a normal CCD color camera. Since both liquids are transparent in the visible and NIR spectral range (400–900 nm), the contrast was governed by the difference in refracting indexes, which are not significantly different between the two phases (water 1.33, corn oil 1.47). The Vis-NIR image is unremarkable overall, and the line between water and oil is difficult to detect. In contrast, the exNIR image elucidates the water-oil boundary. Since water and oil absorb differently at 1210 nm and 1400 nm, their ratio clearly points to location of water.Imaging in vivo
Biological tissue is composed mostly from water, lipids, and proteins, which are the endogenous absorbers in exNIR. The absorptivities of molecular vibrations, similar to electronic transitions, follow Beer-Lambert's law. The intensities of absorption follow the additivity principle, and consequently one can consider the tissue spectra as the sum of different components. Hence, exNIR technology can be applied to a biological tissue to assess the chemical composition of tissue.
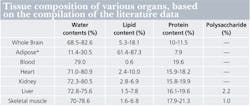
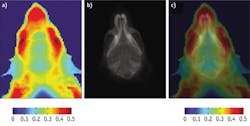
We found that most mouse organs showed bands at 975 nm, 1100 nm, and 1280 nm; these bands correspond to water signals and to several smaller peaks and shoulders originating from the presence of lipids, sugars, proteins, and other tissue components.12 A general comparison of the tissue spectral properties with their contents shows a significant level of correlation (see table).12-14 High water-content biological entities such as blood, kidney, and skeletal muscle shared similar bands, although affected with different shapes. These shapes apparently arose from the presence of different types of lipids, proteins, and other biologically relevant components. Tissues with high lipid content, such as adipose tissue, showed the presence of stronger lipid spectral features.New possibilities
Imaging in the exNIR spectral range provides new possibilities in label-free imaging. Such imaging depends on major endogenous chromophores in biological tissue, water, lipids, and proteins, and capitalizes on attenuated scattering in deep tissues. The position and the intensity of the chromophores' spectral bands depend on the tissue composition and thus allow potential anatomical resolution of the tissue. Moreover, because vibrational bands are sensitive to their surroundings, the method can not only reflect the chemical composition of the tissue, but can also reveal small changes in tissue often associated with pathology.
Acknowledgements
We thank Walter Akers for assistance with animal imaging and discussion, and Steven Wang for helping to set up the equipment. We also acknowledge financial support from Washington University Molecular Imaging Center, Optical Spectroscopy Core facility (NIH 1S10RR031621-01), Amgen fellowship program (D.S.), and Mallinckrodt Institute of Radiology Summer Research Program (Q.C.).
References
1. V. Ntziachristos, C. Bremer, and R. Weissleder, Eur. Radiol., 13, 1, 195–208 (2003).
2. M. Y. Berezin and S. Achilefu, Chem. Rev., 110, 5, 2641–2684 (2010).
3. J. R. Mourant et al., Appl. Opt., 36, 4, 949–957 (1997).
4. S. Achilefu et al., Invest. Radiol., 35, 8, 479–485 (2000).
5. R. Weissleder, Nat. Biotechnol., 19, 4, 316–317 (2001).
6. E. M. Sevick-Muraca, Annu. Rev. Med., 63, 217–231 (2012).
7. B. E. Schaafsma et al., J. Surg. Oncol., 104, 3, 323–332 (2011).
8. K. Welsher, S. P. Sherlock, and H. J. Dai, Proc. Natl. Acad. Sci., 108, 22, 8943–8948 (2011).
9. A. M. Smith, M. C. Mancini, and S. Nie, Nature Nanotechnol., 4, 11, 710–711 (2009).
10. J. Workman and L. Weyer, Practical guide to interpretive near-infrared spectroscopy, p. 332, CRC Press, Boca Raton, FL (2008).
11. J. E. Bertie and Z. Lan, Appl. Spectrosc., 50, 8, 1047–1057 (1996).
12. Q. Cao et al., J. Biomed. Opt., 18, 10, 101318 (2013).
13. A. N. Bashkatov et al., J. Phys. D: Appl. Phys., 38, 15, 2543 (2005).
14. R. Nachabe et al., J. Biomed. Opt., 15, 3, 037015 (2010).
Daniel Salo, David Kim, and Qian Cao are research assistants, and Mikhail Y. Berezin is assistant professor in the Department of Radiology at the Washington University School of Medicine, St. Louis, MO; e-mail: [email protected]; http://berezinlab.wustl.edu.


