Laser Optics: The art and science of designing optics for laser-induced damage threshold

Anyone who has spent time in the optics industry has heard that optical system design is both an art and a science. The science part of that description is clear: the rules of light propagation are rooted in fundamental physical principles described by well-defined mathematical equations. The art is a little tougher to understand: the term “art” encapsulates the tips, tricks, and implicit knowledge that comes through years of experience. Designing optical systems to resist high-energy laser-induced damage is one of those areas that straddle the line between art and science.
Laser-induced damage refers to the processes by which intense light interacts with optics and modifies the coatings, surfaces, or bulk material in such a way as to reduce their performance. Intense light can delaminate coatings, introduce blemishes, and even fracture substrates. The consequences range from decreased transmission and increased scatter to complete system failure. To eliminate these negative effects, the industry has developed a metric called the laser-induced damage threshold (LIDT). Ideally, the LIDT would present a borderline value of laser fluence: Energy density higher than the LIDT would damage an optic, while an optic would be undamaged at a laser fluence lower than the LIDT.
In practice, things aren’t so simple. Light is inherently a stochastic entity, subject to temporal and spatial variations in intensity. But even that is only the tip of the iceberg—laser damage occurs through distinct mechanisms and varies with wavelength and pulse duration. The fabrication processes used to manufacture the optic also have statistical variation and can impact LIDT.
What initially seemed to be a purely deterministic metric, LIDT, is now clearly a complicated value with a high amount of statistical variation. This is where the art has come in—experienced system designers have taken LIDT specifications and added their own “fudge factors” based on an implicit understanding that laser damage is far more complicated than a simple LIDT value would indicate.
Even with this variation and uncertainty, understanding potential damage mechanisms and how to test for their probability makes it possible to reach rational design decisions and create systems with an acceptable level of risk. Understanding what LIDT means, how it will impact your system, and how your optical components are tested will ensure that you are selecting the proper optics for your application. Below is an overview of the information system designers should consider.
Damage mechanisms
Damage from continuous-wave (CW) lasers is typically a result of thermal effects caused by absorption in the optic’s coating or substrate. Damage from nanosecond pulses from pulsed lasers, on the other hand, is typically initiated by different processes before thermal buildup can occur. Nanosecond pulses are also too long for nonlinear effects to be the primary damage mechanism, but they can lead to dielectric breakdown, where current flows through an electrical insulator because the voltage applied across it exceeds its breakdown voltage. This process is driven by the electric-field strength and is the most deterministic of the damage mechanisms, because if the electric field is above a given threshold there will be dielectric breakdown. This can lead to delamination and further damage.
Dielectric breakdown is the typically the dominant mechanism of damage for small beams on the order of tens of microns or less or for femtosecond pulses. For large beams on the order of hundreds of microns and up, the dominant damage mechanism typically becomes the thermally driven explosion of particulate contaminants.
Damage mechanisms that are triggered by the interaction of light with a defect of some type are not so straightforward. For example, the grinding and polishing process can produce microfractures in the optic that can be the initiating sites of laser damage. Ideally, each successive stage in the polishing process is finer and will eliminate any fractures from the previous steps, but no process is truly ideal and some level of subsurface damage will remain.
Another potential defect source is microscopic particles of polishing abrasive that can remain on the surface through successive stages, including coating. The coating process itself can lead to another potential defect source. Typical metal oxide dielectric coatings are created by vacuum deposition of material from a sputtered target, and clusters of metallic elements can form during the coating process. Defect-driven LIDT can be represented using a stochastic model because of the random location of these defects relative to the center of the laser beam.
Each of these distinct defect sources exhibits equally distinct absorption characteristics, as the nature and size of any given defect determines the laser fluence it can withstand without causing damage to the optic. The next step of designing with LIDT in mind is to determine how these defects impact the performance of the optics in a given system. This is what allows laser-optics integrators to extrapolate LIDT specifications into an acceptable level of risk for their laser system.
Acceptable degradation and risk
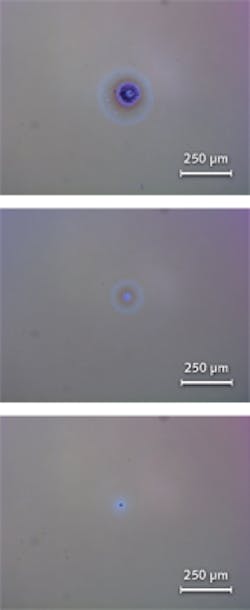
The tolerable level of degradation in a system is entirely application-dependent. For example, a 10% reduction in transmission may be tolerable in some situations, while another system might fail if more than a percent of the incident light is scattered. According to the ISO 21254:2011 standard, any detectable change in the coating is considered damage. Different laser-damage tests use distinct damage-detection schemes, and specific users might choose a different threshold for the signal-to-noise ratio, so different LIDT values can be produced depending on how the test was performed (see Fig. 1). It is important to realize that the ISO-defined damage doesn’t necessarily imply performance degradation because this is system-dependent.
The amount of acceptable risk is also entirely application-dependent. No optic and no laser-damage testing are perfect, so some finite risk of laser damage will always remain, even well below the LIDT. Only the system designer can define the acceptable level of risk. For example, a spaceborne light detection and ranging (lidar) system with a three-year design lifetime has a much lower level of acceptable risk than a lab prototype for a multiphoton fluorescence microscope.
Once the system designer understands the relevant laser characteristics, the required level of performance, and the tolerable level of risk, they can now evaluate component specifications from laser-optics vendors and determine if a given component will meet their requirements. That decision requires an understanding of how the LIDT value is determined.
LIDT testing
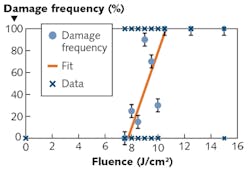
Laser-damage testing is inherently a destructive test. An optic is exposed to a given level of laser fluence and then is examined, typically with a differential interference contrast microscope. The fluence is then increased, and the exposure and examination steps are repeated. This process continues until damage is observed on the optic. Conceptually, this is a simple process, but it hides several levels of complexity (see Fig. 2).This uncertainty is mitigated by making many measurements. However, not every possible use scenario can be tested because high-energy lasers are expensive, and it is unrealistic to expect a vendor to have a stable of high-energy lasers covering every wavelength range and every possible temporal characteristic.
Vendors can test at high fluence levels much more easily by interrogating an optic with a small-diameter beam. However, this can lead to the surface being undersampled, possibly missing some defects on the sample. It would take 400 exposures to cover a 40-mm-diameter optic with a 2-mm-diameter beam. Factor in the several different exposures at difference fluence levels and then add in some reasonable lot sampling, and it becomes clear that some statistical sampling and simulation is necessary for practical testing. The goal of this simulation is to answer questions such as, “given that damage was not detected at 40 J/cm2 with 60% of the surface sampled by one pass of a 2-mm-diameter top-hat beam, how likely is it that the damage threshold for this full optic is actually below 40 J/cm2?”
The answer can’t be determined from that set of measurements alone, as it requires a full set of exposures to different fluence levels and a stochastic model of the damage processes. A stochastic model of LIDT will include the beam size and intensity profile, the areal coverage, and some information about the nature and distribution of the defects.
Modeling LIDT using the stochastic model
Within this discussion of the mechanisms of laser damage and the models for determining LIDT, it is easy to overlook an essential point: it is very unlikely that the laser-damage measurement will overestimate the LIDT. Exposing an optic to twice the fluence of its LIDT will almost certainly damage it. The uncertainty arises at and below the specified LIDT. There is some finite probability that an optic will be damaged at levels well below the LIDT.
At this point a system designer has defined the laser, determined the tolerable level of damage, and calculated the acceptable risk. So how can the designer then determine if a given optic with a specified LIDT will meet the system’s needs? The starting point is to understand exactly how the vendor has determined the LIDT. What sampling protocol was used? What laser, with what intensity profile? How did the vendor characterize the defects?
Knowing that, there are some rules of thumb that can be used to extrapolate vendor test results into predictions of performance in a given system. Given an LIDT determined with a test at a wavelength of λ1 with a pulse length of τ1 and a beam diameter of ∅1, the LIDT at a wavelength of λ2 with a pulse length of τ2 and a beam diameter of ∅2 can be estimated as:
However, there is a caveat to this equation—this expression only works if the parameters of the two lasers are close to one another.
The best solution is to test for laser damage under the exact conditions in which the optic will be used. Barring that, a system designer should demand exact information about the test conditions under which LIDT was determined. In addition, designers should also have some degree of confidence that their optics fabrication partners have their processes under control so that defects are well understood. Understanding LIDT and how your optical components were tested will allow you to know that you are selecting the proper optics for your application. With the variables defined, the defects characterized, and the stochastic model well established, system designers can be confident they are moving their own process from art into science.
About the Author
Cory Boone
Cory Boone is technical marketing manager at Edmund Optics. He is responsible for managing the creation of technical marketing content, including application notes, published articles, web copy, email campaigns, video scripts, trade show materials, case studies, and other marketing literature. He plans the company’s technical content strategy and acts as the technical voice of the marketing department. Cory is also active in educational outreach and spreading general awareness of the optics industry. He received a B.S. in Optical Sciences and Engineering along with minors in Math and Material Science Engineering from the University of Arizona.
Nathan Carlie
R&D Manager, Edmund Optics
Nathan Carlie is R&D manager at Edmund Optics (Barrington, NJ).

