Spectroscopy indicates biomarkers for Alzheimer's disease
In this century's first decade alone, mortality resulting from Alzheimer's disease (AD) rose 68%. AD is now the sixth leading cause of death in the U.S. and despite substantial scientific research, a cure is nowhere in sight. In fact, even an understanding of AD's molecular mechanisms eludes us. But new research shows that label-free optical spectroscopy may enable operational insight and perhaps even early diagnosis so that patients can make decisions while still cognitively able, and begin treatment to delay deterioration. In the meantime, though, many people with AD remain undiagnosed.
In 1984, Robert Alfano and colleagues at City University New York pioneered the use of label-free optical spectroscopy to detect cancer by reading the fluorescence levels of native organic biomolecules in tissues. Later lab members expanded upon this work, applying spectroscopy to determine levels of tryptophan, reduced nicotinamide adenine dinucleotide (NADH), flavin, and collagen in normal and diseased tissues to diagnose certain types of cancer. A new application of label-free optical spectroscopy created by an international team led by Alfano and Lingyan Shi, now of Columbia University (New York, NY), reveals molecular components of brain tissue and how they are distinct from other tissues.1
Spectroscopy measures mitochondrial abnormalities
Dysfunction of mitochondria, which are essential for energy production, is correlated with AD and other diseases: AD brain tissue has shown evidence of NADH-linked mitochondrial enzymes as well as tryptophan kynurenine metabolism. Early identification of mitochondrial dysfunction could facilitate not only better understanding of AD's mechanisms, but also early disease detection.
The researchers theorized that such intracellular coenzymes, important for cellular oxidation-reduction (redox) reactions, could serve as intrinsic biomarkers for metabolic activity and mitochondrial dysfunction.
To test the potential of NADH, flavin adenine dinucleotide (FAD), and tryptophan for indicating AD, the researchers used fluorescence spectroscopy to assess and compare normal and early-stage AD mouse brain tissue specimens. Their study shows for the first time the fluorescence spectra of these major molecular building blocks in normal and diseased mouse brain tissues.
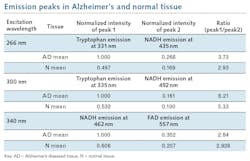
The researchers found higher emission spectral-profile levels of tryptophan and NADH in AD samples vs. normal samples (see table). They also discovered that fluorescence intensity levels for all three were higher in AD tissue than healthy tissue, meaning that the AD brain shows reduced nonradiative relaxation processes. Finally, they noted that the intensity ratio of tryptophan to NADH and the change rate of fluorescence intensity with respect to wavelength were boosted in the AD specimens.
Emission spectra examined
At a 266 nm excitation wavelength, both AD and N tissues showed fluorescence peaks at the same wavelength (about 330 nm), which corresponds to the emission peaks of tryptophan. But the researchers observed significant difference in tryptophan peaks between AD and N (P = 0.001). A weak secondary peak at 430 to 460 nm, because of NADH, may result from fluorescent resonance energy transfer from excited tryptophan to NADH as well as second singlet excitation from 266 nm. Averaged peak intensities are higher in AD than N tissue: 2.01 for tryptophan (1.000 vs. 0.497) and 1.58 for NADH (0.268 vs. 0.169), respectively.
At 300 nm excitation, results are similar: Emission intensities of AD and N tissues both peak at 330-350 nm, matching tryptophan's emission peak. Again, the weaker second peaks, at 430–460 nm, relate to NADH, while mean peak intensities of tryptophan and NADH tissue are 1.88 (1.000 vs. 0.532) and 1.61 (0.161 vs. 0.100) higher in AD than N tissue, respectively.
Finally, at 340 nm excitation, emission peaks of AD and N at 430-460 nm match NADH's emission peak; weak second peaks at 530-560 nm relate to FAD. The mean peak intensities of NADH and FAD are 1.65 (1.000 vs. 0.606) and 1.70 (0.352 vs. 0.207) higher in AD vs. N, respectively.
Comparing the intensity ratio of tryptophan to NADH, the team found average ratios of 3.73 in AD and 2.93 in N tissue at 266 nm excitation, and 6.21 in AD compared with 5.33 in N at 300 nm excitation. While the ratios of NADH to FAD are not significantly different in AD and N, comparison of spectral peaks for tryptophan and NADH, and their relative ratio near tryptophan's absorption peak, may be a useful measure for diagnosing AD.
This work not only shows that tryptophan, NADH, and FAD are indeed effective biomarkers for AD, it also demonstrates an effective optical method for measuring fluorophore-composition differences in AD vs. normal brain tissues, and for detecting early-stage AD by comparing spectral profiles. Experiments with time-resolved fluorescence using a streak camera confirmed the reduction of nonradative processes in AD tissue, and showed slower relaxation emission lifetime in AD.2 Future work could use time-resolved fluorescence lifetime measurements to localize these changes, along with long-wavelength multiphoton excitation to provide deeper tissue penetration.
REFERENCEs
1. L. Shi et al., Sci. Rep., 7, 2599 (2017); doi:10.1038/s41598-017-02673-5.
2. B. Das, L. Shi, Y. Budansky, A. Rodriguez-Contreras, and R. Alfano, J. Biophoton., 1864-0648 (2017); doi:10.1002/jbio.201600318.
About the Author

Barbara Gefvert
Editor-in-Chief, BioOptics World (2008-2020)
Barbara G. Gefvert has been a science and technology editor and writer since 1987, and served as editor in chief on multiple publications, including Sensors magazine for nearly a decade.