Raman Spectroscopy/Cell Analysis: Raman-based imaging makes cell-based assays quantitative

Cell-based assays are key in modern drug development. In recent years, the original approach of spreading a single layer of cultured cells onto a flat substrate has given way to 3D cell culture systems, which better represent cells' natural environments and produce more predictive data. But the leap in dimensionality has had no effect on the fact that the optical techniques traditionally used for analysis are not fully quantitative. And the gold-standard approach, confocal fluorescence microscopy, requires introduction of exogenous labels that can impact both intracellular processes and overall cell function.
The need for quantitative, nondestructive tools led scientists at Imperial College London to develop quantitative volumetric Raman imaging (qVRI), a novel, label-free method of imaging multiple biomolecules simultaneously within 3D cell culture environments. Developed in the lab of Molly Stevens, Professor of Biomedical Materials and Regenerative Medicine and Research Director for Biomedical Material Sciences (whose work won the Royal Pharmaceutical Society's 2017 Harrison Prize), qVRI visualizes 3D cell morphology, quantifies biomolecular structures with submicron-size detail, and provides biochemical information on the sample. The researchers have demonstrated the use of qVRI to highlight the relationship between spatial resolution and molecular specificity, and have added spectral unmixing to characterize relevant biomolecules and resolve them into subtypes.
Raman hardware and data handling
The researchers performed their 3D imaging using a confocal Raman microspectroscope fitted with a 532 nm laser and a 63X, 1.0 numerical aperture (NA) water immersion objective lens. A 50-μm-diameter fiber directed scattered light to the spectrometer and also acted as a pinhole for confocality, while a CCD camera (with spectral resolution of 10 cm) acquired the spectra and collected Raman images through 10 layers spanning a cell's depth.
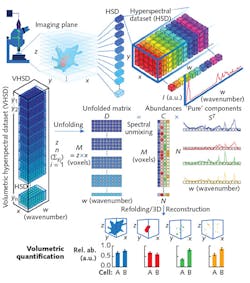
This confocal system not only enabled 3D control over the specimens' position, but also produced a 3D hyperspectral dataset covering both spatial and spectral dimensions (x × y pixels, and wavenumber, or w, respectively) in each imaging plane, with every 3D voxel corresponding to a single Raman spectrum (see figure). Combining the planar data generates a volumetric hyperspectral dataset (z × x, with z equaling the sum of y planes).
The researchers tailored their computational framework to effectively handle volumetric hyperspectral datasets measured from a z-stack of Raman images. It collects all hyperspectral datasets from each z layer, and assembles and unfolds them into a single data matrix. It then individually preprocesses each Raman spectrum of a hyperspectral dataset. The unfolded data can then be reconstructed directly based on univariate peak intensities, or else processed using a spectral unmixing algorithm.
The computationally efficient algorithm that the researchers chose, vertex component analysis (VCA), works on the idea that multiple voxels (with nearly pure "endmember" components) comprise a cell's volume. Endmembers, which are actual spectra arising directly from preprocessed volumetric hyperspectral data, represent the voxels containing the purest amounts of specific biomolecules. The endmembers essentially describe the biomolecular structure of the entire cell, including its organelles. Thus, the researchers were able to associate each voxel with biomolecular relative abundance values. They say that each biomolecular component can then be refolded for 3D volumetric visualization and quantification.
Putting qVRI to work
The researchers applied their comprehensive qVRI framework in 2D and 3D cell-culture system experiments to visualize, identify, and quantify biomolecules. By imaging a variety of cell types in conventional culture systems and 3D biomaterials, they discovered the ability of spectral unmixing techniques to reveal an intimate relationship of spatial resolution with biomolecular specificity.
They took advantage of this discovery to visualize fine details—the shape of 3D cells, for instance, and such intracellular structures as cytoplasm, nucleus, various lipids, protein-rich clusters, and submicron cytoskeletal anatomy—with a biomolecular specificity unprecedented for vibrational microspectroscopy. They also used Raman datasets in a 3D cell culture system to spatially monitor such complex biological processes as differentiation, thus demonstrating the first known volumetric quantification of endogenous biomolecules.
The researchers expect qVRI to facilitate a range of applications in cell biology and tissue engineering with highly valuable complementary information. Eventually, qVRI may even reveal complex cell-material interactions within 3D culture systems, and enable measurement of previously unquantifiable cell behavior and function in advanced biomaterials.
REFERENCES
1. R. Edmondson et al., Assay Drug Dev. Technol., 12, 4, 207–218 (2014).
2. C. Kallepitis et al., Nature Commun., 8, 14843 (2017); doi:10.1038/ncomms14843.
About the Author

Barbara Gefvert
Editor-in-Chief, BioOptics World (2008-2020)
Barbara G. Gefvert has been a science and technology editor and writer since 1987, and served as editor in chief on multiple publications, including Sensors magazine for nearly a decade.