Thermal Imaging: Liquid-crystal thermography characterizes heat issues
BAHMAN TAVASSOLI
Knowing the temperature distribution of an electronic component is vital to characterizing its thermal and electrical performance. Liquid-crystal-based thermography provides engineers with a relatively inexpensive method for measuring surface temperatures, which are central to the overall characterization process.
Unlike conventional materials, liquid crystals (LCs) do not alter abruptly from a solid to a liquid state when heated. Instead they move through an intermediate liquid-crystal phase. The temperature at which the LC moves into and out of the crystal state is sharply defined and depends on the chemical crystal composition of the material.
Changes in the state of a liquid crystal are accompanied by changes in optical behavior, such as turning translucent or opaque. In the liquid-crystal phase these materials exhibit dual properties of anisotropy (having different properties when measured in different directions), and bireflectance (splitting a light beam into two components).1
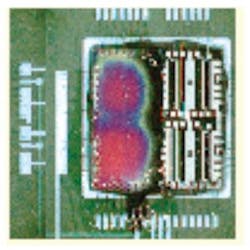
Thermochromic liquid crystals (TLCs) are a class of materials that reflect definite colors at specific temperatures and viewing angles. By using TLCs together with solid-state cameras, image digitizers, and higher-speed computer processors, a liquid-crystal thermography system can be built that makes fast, accurate, high-resolution surface-temperature measurements for locating hot spots and defects on electronic components, microcircuits, modules, and printed-circuit boards (see Fig. 1).
Thermochromic liquid crystals
When a TLC is at its event temperature-the temperature at which liquid crystals scatter visible light-various colors will be reflected under controlled optical conditions. As the temperature rises or falls, the reflected colors coming from the TLC will change. When the temperature exceeds the clearing-point temperature of the TLC—the temperature at which liquid crystals become a normal isotropic liquid—the material becomes transparent.2
Normally clear or slightly milky in appearance, liquid crystals change in appearance over a narrow range of temperature, called the color-play interval. This is the interval between the first (red) and last (blue) reflection. The displayed color is red at the low-temperature margin of the color-play interval and blue at the high end. Red corresponds to longer wavelengths; blue to shorter wavelengths. Within the color-play interval, the colors change smoothly from red to blue as a function of rising temperature, with blue light corresponding to the clearing-point temperature.3
Thermochromic liquid crystals also transmit significant amounts of the incident light with no modification. To help prevent this transmitted light from affecting the correct interpretation of the selective reflections, TLCs should be viewed against a nonreflecting background, such as flat black. This can be achieved by simply applying black paint to the target components.
Working with TLCs
Pure liquid-crystal materials are thick, viscous liquids. Because of their inherently oily form, pure TLCs can be difficult to work with, and their thermal performance degrades rapidly due to chemical contamination and exposure to ultraviolet radiation. Methods to help protect the stability of TLCs include microencapsulation and dispersing the material in a polymer-based matrix.
The chemical make-up of a TLC material fixes its color-temperature response profile. Narrow-band TLC formulations have bandwidths below 1°C or 2°C, while wide-band formulations range between 5°C and 20°C.
Qualitative temperature-visualization techniques for TLCs are easy to implement. They can provide high spatial resolution when properly used in applications that provide optical access to the TLC-coated surface. A typical use can reveal an electronic component’s temperature response to changes in thermal conditions, such as the rate of airflow or the orientation of a printed circuit board (PCB) component.4
The proper use of LC thermography involves choosing a TLC formula that will cover the temperature range of interest, setting the light source intensity and optical viewing equipment, and applying the LC material to a calibration surface and to the device being evaluated. It is important to apply enough power to the device to induce a TLC color reflectance. Next, the color image is electronically captured and processed using calibrated color-temperature response information to reveal the temperature distribution of the device (see Fig. 2).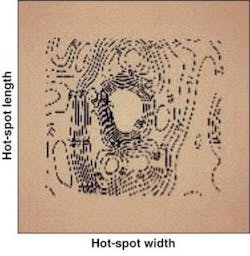
The activation temperature and bandwidth of a TLC formula are determined by its chemical composition at the time of manufacture. The TLC activation temperature is that at which a TLC begins to reflect visible light. The temperature bandwidth defines the relative color response range for the TLC formula. Formulas with activation temperatures ranging from -30°C to 120°C and bandwidths ranging from 0°C to 30°C are commercially available.
A sufficiently bright and stable white-light source is needed to obtain accurate and reliable reflected light intensity measurements from the TLC-coated surface. White-light sources that remove infrared (IR) and ultraviolet (UV) radiation from their output spectrum are preferred. Any IR energy present in the incident light spectrum will cause unwanted radiant heating of the test surface. Exposure to UV radiation can cause rapid deterioration of the TLC surface, which will result in unreliable color-temperature responses.
Consistent light-source settings and lighting-viewing arrangements between the calibration and actual testing of a device are essential to minimize color-temperature interpretation errors. Because the perceived color of a pure TLC at a fixed temperature is also dependent on the amount of background and/or secondary light present, a coaligned primary lighting-viewing system can minimize this dependency.
Surface treatment and image capture
Liquid-crystal thermography is based on assigning temperatures to colors reflected from a device coated with TLC materials. Proper surface preparation is important for obtaining high accuracy and begins with applying a thin layer of inert black paint, followed by a thin coating of the liquid-crystal material. The consistency and uniformity of these layers are essential for accurate calibration and specimen measurement. If there are significant differences in the consistency of the test and calibration surfaces, the reflected visible light will be adversely affected and measurement errors will result. The best results are obtained when the test and calibration surfaces are prepared at the same time.
The reflected color image is captured by a video camera, compared to a standard temperature scale and processed by a computer. A multicolor map is produced, and because there is a direct correlation from color to temperature, the resulting map provides a true indication of component temperatures.
To quantify the results of liquid-crystal thermography, the color-temperature response of the LC material needs to be calibrated. This process is similar to calibrating the voltage-temperature response of a thermocouple. Color-temperature-response calibration of the TLC is done by subjecting the TLC to known temperature levels and then recording the response of the TLC. For accurate quantitative measurements, a color-sensitive camera should be used. The camera improves on the limited color sensitivity of the eye by recording color response while it is subjected to successively higher levels of temperature on a test surface. The system then analyzes the color-temperature responses and builds the calibration data used to interpret the color response of the TLC when it is applied to the device under test.
Liquid-crystal thermography allows a trained eye to make effective preliminary observations about an electronic component under test. However, more-accurate and repeatable measurements should be made with instrumentation, in this case, using a solid-state color camera and a computer. This approach uses the processing speed and power of modern cameras and data processing to quickly and accurately capture and interpret the color images of TLC-coated surfaces (see Fig. 3).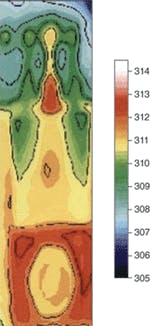
The spatial resolution available with LC thermography is limited by the formulation of the TLC and the resolution capability of the camera system. TLC formulas that are not encapsulated can provide submicron spatial resolution over reasonably sized fields of view when targeted by higher-performance microscope optics. Processing software tools allow users to extract a color or temperature image plane by region of interest, determine valid regions of the image, and apply spatial filters. Users can also benefit from analysis software tools that provide dynamic data-probing capabilities to calibrate the physical-to-screen coordinate system for images being analyzed. This feature provides a simple mechanism to make spatial measurements of the thermal phenomena in their thermographs.
Because TLCs operate using visible light, common optics systems and color cameras can be used to create reasonably priced LC thermography systems. The benefits are accurate, high-resolution temperature measurements in applications ranging from ultra-high-resolution submicron-level devices to larger devices and complete circuit boards.❏
REFERENCES
1. G. Jacob, Evaluation Engineering35, 8 (August 1996).
2. D. Farino, Electronics Cooling1, 2 (October 1995).
3. J.A. Stasiek and T.A. Kowalewski, Opto-Electronics Rev.10(1) 1 (2002).
4. K. Azar and D. Farino, Electronics Cooling 3, 1 (January 1997).
BAHMAN TAVASSOLI is chief technologist at Advanced Thermal Solutions, 89-27 Access Rd., Norwood, MA 02062; e-mail: [email protected]; www.qats.com.