Multivariate optical elements simplify spectroscopy
MICHAEL MYRICK
Interference filters with carefully designed spectral properties perform optical computations for spectroscopic analysis that replace complex mathematical computations.
Pattern-recognition techniques can be applied to optical spectra of complex mixtures (gasoline, blood, environmental samples, and so on) for the purpose of detecting the presence of specific compounds, measuring their concentrations, or estimating properties that depend on sample chemistry. Based on multivariate (multiwavelength) calibration, this approach to chemical measurement is powerful, but is used infrequently because of the expense and complexity of the spectroscopic tools required. In contrast, instruments can be made with the mathematics of pattern recognition designed directly into optical interference filters. These filters extract information from light without recording a spectrum. This approach points to a revolution in low-cost, rugged, high-quality instruments.
The problem of interferents
Optical spectroscopy is an effective tool for "fingerprinting" the composition of matter. Identification of sample chemistry, however, requires that enough of the spectroscopic fingerprint be observed to be useful, which can require measurement at many different optical wavelengths. Sensible use of multiwavelength optical spectroscopy of complex samples requires techniques of simple multivariate pattern recognition and calibration.
Multivariate calibration is the process by which multivariate data are analyzed to reveal patterns specific to a chemical measurement. For example, when three different dyes whose optical absorption spectra overlap are mixed randomly to make solutions, estimating the concentration of one of the dyes (the analyte) from the spectra alone in the presence of the others becomes a complex process. The difficulty arises because the other dyes serve as "interferents"—that is, chemical species whose spectra are convoluted with that of the species we hoped to measure.
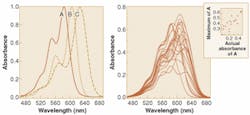
The simplest way to estimate the amount of one of the dyes in a three-dye mixture is to measure the absorbance of the mixtures at the wavelength of maximum absorbance of the analyte dye. A comparison of this estimation against the actual absorbance of the analyte in the mixtures usually shows poor results (see Fig. 1).
PCR: a mathematical approach
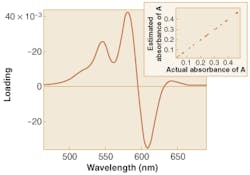
A better approach makes use of pattern recognition. Using a technique known as principal components regression (PCR), a pattern in the spectra of the mixtures can be identified that gives good prediction of the analyte (see Fig. 2).1 A simple form of pattern recognition, PCR dramatically improves the estimation of analytes in the mixtures.In PCR, it is the magnitude of the spectral pattern in the mixture that improves estimation of analytes whose pure spectra are obscured by interferences. The magnitude of the pattern in a mixture spectrum is evaluated mathematically by multiplying the intensity of the spectrum at each wavelength by the value of the pattern at the same wavelength, and then summing the result over all wavelengths. The optical spectra and the patterns used to interpret them can be thought of as vectors in hyperspace, with the actual concentrations of species related to the projection of the spectral vectors onto the pattern vector. Because PCR patterns can be viewed in this way, they are often called regression vectors.
Multivariate calibration begins with the acquisition of optical spectra in an appropriate wavelength region for a series of samples with known chemical properties. Next, calibration methods such as PCR are used to extract a spectral regression pattern that is correlated to the property of interest but orthogonal to interferences. Prediction of the property in an unknown sample is then carried out by taking the inner product of the regression vector and the optical spectrum of the unknown sample.
Some practical applications of this technique include the detection of chemical warfare agents in air or water, noninvasive measurement of glucose in the blood of diabetic patients, measurement of fuel octane rating, analysis of the severity of burns, urinalysis, breath analysis, chemical process control, and chemical imaging. A major obstacle to the widespread use of multivariate calibration is that, once a pattern specific to a chemical measurement has been determined, the equipment needed to measure the pattern in new samples is just as expensive as that needed to find the pattern in the first place. This is because, until now, the spectroscopic equipment necessary for the former has been identical to the equipment required for the latter. This equipment (monochromators, detectors, computers and control systems, temperature regulators, and so on) can cost between $10,000 and $250,000 per installation.
MOEs: the optical approach
New work may point the way to a revolution in the use of multivariate spectroscopy for consumer applications.2 The goal is to replace the conventional spectroscopy systems now used for multivariate measurements with special optical filters known as multivariate optical elements (MOEs), which are used to measure the magnitude of a multivariate pattern in the spectrum of a sample without actually measuring a spectrum. They are estimated to cost about the same as conventional interference filters, creating a potential for sophisticated multivariate chemical sensors that cost $50 to $250.
Multivariate optical elements work to make chemical predictions by doing an optical computation equivalent to that computed mathematically for PCR. To do this, MOEs are used as optical beamsplitters with a carefully designed spectral transmittance. Light coming from a sample is partially reflected by the MOE, with the amount depending on the wavelength. Light from the sample at wavelengths across the spectrum strikes the MOE. The magnitude of the total transmitted and reflected intensities is measured with a corrected optical detector.
The difference between the transmittance and reflectance of an MOE is proportional to the chemical or physical property for which the regression pattern was developed. Using simple optical computing, multivariate optical elements mimic the performance of a full spectroscopy system using traditional analysis. The throughput and efficiency of the system is two to four orders of magnitude higher than conventional spectrometers, making lower-cost detectors practical.
Demonstrated effectiveness
Estimation of dye concentrations in a set of mixtures has been done experimentally with an MOE (see Fig. 3). The demonstration showed that multivariate measurements are possible with MOEs, and was particularly promising since the measurement was made with low-cost silicon photodiodes at a light level that would have been below their detection limits had a conventional spectrometer been used.The design of an MOE generally requires the assembly of several pieces of a common spectroscopic puzzle. Successful designs take into account spectral characteristics of light sources, detectors, and optics; dispersion characteristics of the materials used to make the MOE; and calibrated sample spectra for pattern-recognition-based analysis. With these pieces assembled, designs can be generated relatively quickly with recently developed algorithms.3 With a design in hand, the production of large numbers of MOEs for consumer-level sensor devices is a reasonable possibility.
REFERENCES
1. H. Martens and T. Naes, Multivariate Calibration (John Wiley & Sons: New York, 1989).
2. O. Soyemi et al., Anal. Chem. 73, 1069 (2001).
3. O. Soyemi, Anal. Chem. (submitted).
Michael Myrick is an associate professor in the Department of Chemistry and Biochemistry at the University of South Carolina, 631 Sumter Street, Columbia, SC 29208; email: [email protected].


