Photonics Products: Raman Spectrometers - Raman microscopes serve science and industry
Based on detecting wavelength shifts in laser light that is inelastically scattered from molecules, Raman spectroscopy is a well-established and valuable technique for identifying substances, and is widely used in science, industry, medicine, and security-related applications. Sometimes, the specimen to be examined has fine variations in chemical composition, in which case a Raman microscope often becomes the instrument of choice.
A Raman microscope is in essence an optical microscope paired with a Raman spectrometer. Sometimes, the microscope is modified or specifically made for the purpose of Raman spectroscopy. A Raman microscope can be designed to be paired with a separate Raman spectrometer, or it and the spectrometer can be created as a unit. Both approaches are available commercially.
Manufacturers' approaches to the laser, optical, mechanical, electrical, and software design of Raman microscopes vary. The following are a few illustrative examples of what can be had on the market, along with some applications.
Dispersive confocal design
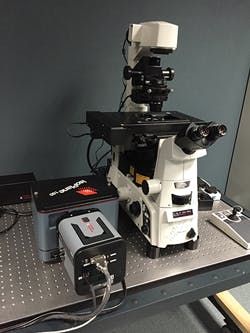
Spectrometer manufacturer BaySpec (San Jose, CA) produces a dispersive multiwavelength confocal Raman microscope called the Nomadic, with f/2 spectrograph optics, according to Lynn Chandler, product manager at BaySpec. The dispersive element in the instrument is a volume phase grating (VPG), a type of grating that consists of periodic refractive-index variations in a volume material—such a grating has higher efficiencies than surface-based gratings. The Nomadic module is coupled to a research-grade microscope made by Olympus (Tokyo, Japan).
Detection of Raman-scattered light by the Nomadic is done via cooled CCD and indium gallium arsenide (InGaAs) detectors. The instrument can be equipped with multiple laser-excitation wavelengths from visible to near-infrared (NIR)—for example, 532, 785, and 1064 nm, or other (custom) wavelengths. Each excitation laser source comes with its dedicated spectrograph and detector, which Chandler says ensures optimal spectral coverage and resolution while maximizing sensitivity. She notes that the pre-aligned and pre-calibrated dispersive spectrograph design allows automated laser switching with no moving parts.
The instrument's imaging software has multivariate analysis tools, such as maximum covariance analysis (MCA), principal component regression (PCR), and partial least squares (PLS). Chandler says that the Nomadic allows measurements beyond conventional Raman imaging, including dark-field Rayleigh scattering, photoluminescence imaging, and atomic-force microscope (AFM) Raman.
"High fluorescence backgrounds encountered in complex samples have limited the use of Raman spectroscopy," Chandler says. "Fourier-transform (FT)-Raman has been the traditional solution for suppressing fluorescent interferences, but is relatively cumbersome with constant moving parts and long acquisition times. Moreover, the FT-Raman microscope system has limited spatial resolution, and is not suitable for confocal optics to achieve diffraction-limited spatial resolution of around 1 μm."
Combining confocal optics with single-mode 1064 nm laser excitation allows reaching diffraction-limited, micrometer-level spatial resolution to suppress fluorescence background for highly fluorescent complex samples with microscale sampling, according to Chandler.
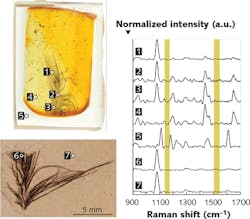
"One actual application is in archeology research of ancient fossils," she notes. "Feathers can occasionally be found embedded in fossil amber; the individual parts of the feather are approximately 10 μm in diameter, which requires microsampling. The feathers can hold clues about the color of the prehistoric animals."
Carotenoids provide shades of red, orange, and yellow in modern bird plumage, Chandler explains. With the Raman technique, carotenoid can be verified by its distinct Raman spectrum (see Fig. 1). The difficulty in measuring any inclusion in amber has been getting through the highly fluorescent amber itself, which obscures the Raman signal from carotenoids. Using a 1064 nm excitation wavelength with the Raman confocal microscope, carotenoids were demonstrated to be measurable in modern feathers under amber. The technique was then successfully applied to fossil feathers preserved in amber.1
Design for ruggedness
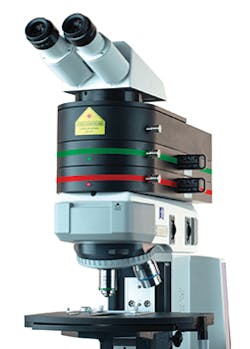
CRAIC Technologies (San Dimas, CA) designs and builds a series of microspectrometers, including Raman microspectrometers (another term for Raman microscopes) for routine research, as described by Paul Martin, the company's president. "As such, they are designed to be capable, rugged, and reliable," he says. "Systems are aligned at the factory and then installed by factory technicians at the customer site to ensure proper functioning."
The basic design of the instrument, which is called the Apollo, uses a laser with free-space illumination of the sample through a suitable microscope objective—the Raman-scattered light is collected by the same objective and is imaged onto the entrance slit of the Raman spectrometer. Fitted with a cooled CCD detector, the Raman spectrometer measures the intensity of the Raman-scattered light.
Thus, the Apollo is a modular system in which each laser is matched with a separate Raman spectrometer, Martin says. Each spectrometer is optimized for each laser to yield optimum results and system flexibility. With such a design, up to three lasers can be supported on each system: the system's software includes spectral-analysis capabilities, Raman databases, and 5D Raman spectral mapping of surfaces at a high spatial resolution, Martin notes.
The Apollo Raman microspectrometer can be had with laser wavelengths ranging from 405 to 830 nm at output powers of either 50 or 100 mW. "Each laser is matched with a custom-optimized Raman spectrometer to maximize performance of the system," Martin says. Using the 785 nm laser as an example, a standard configuration would have a 120–3000 cm-1 spectral range and a sampling area as small as 3 μm. Combined with a programmable stage, this allows the user to create high-spatial-resolution maps of the entire sample.
Martin notes that the Apollo Raman system can also be added to other CRAIC microspectrophotometers to add Raman to the UV-visible-NIR absorbance, reflectance, polarization, fluorescence, and photoluminescence spectral and imaging capabilities of the company's microspectrophotometer.
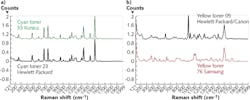
In one application example, CRAIC Technologies was asked to take part in a federal research project to determine spectral and statistical methods for differentiating the chemical components of several types of printing inks (see Fig. 2). The Apollo instrument was configured to acquire spectra with 532 and 785 nm lasers. Spectra were collected from more than 300 ink samples of different colors, including black, in multiple locations on each sample. Calculations were performed to determine the ability to discriminate between the ink samples.Integrated microscope and spectrometer
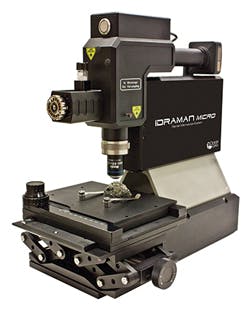
As mentioned previously, a Raman microscope can either be paired with a separate spectrometer unit or it can be made part of an integrated instrument design. An example of the latter approach is the IDRaman micro Raman microscope made by Ocean Optics (Dunedin, FL). "This is unique in that the optics are designed around the spectrometer rather than traditional systems that bolt a spectrometer on to a microscope," says Rob Morris, marketing manager at Ocean Optics.
The IDRaman micro has a microscope that is optimized for Raman sampling by the company's partner Snowy Range Instruments (now Metrohm Raman; Laramie, WY). Morris explains that the setup uses the same focal plane for collecting images and Raman signals, simplifying the inexact process of acquiring data from a specific structure or location on a sample. Versions are available with 532, 638, or 785 nm Raman excitation, with resolution ranging from 4 to 10 cm-1 depending on the model.
"The co-localization of the Raman and imaging plane in the system makes the IDRaman micro ideal for measuring samples that require careful focus and high spatial resolution to optimize the Raman signal," Morris says. "Examples include monitoring quality in powders, detecting impurities in graphene and other materials, and improving surface-enhanced Raman spectroscopy (SERS) applications such as trace level detection of pesticides and explosives."
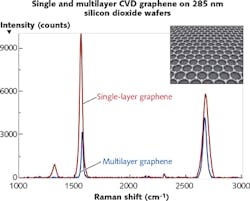
Carbon nanomaterials like graphene, fullerenes, and carbon nanotubes have unique electrical, thermal, chemical and mechanical properties, he adds, noting that Raman spectroscopy is ideal for rapid and nondestructive characterization of materials. In graphene, several key bands can be used to assess the number of graphene layers and the purity and quality of the sample (see Fig. 3).The G band observed at ~1580 cm-1 is a good indicator of the number of graphene layers, Morris explains, with band position shifting to lower energy as layer thickness increases, dependent on doping and strain. The G' band at ~2700 cm-1 can also be used, albeit via a more-complex relationship. The intensity of the D band at ~1350 cm-1 is related to the number of defects in the material (amorphous carbon), a marker of purity. It, too, increases in intensity with the number of graphene layers.
With sufficient data collected across multiple measurements, accurate models could be created for determining graphene layer thickness and purity. "This is relevant for researchers and developers using graphene to design and assemble electronics, conductors, photovoltaics, and aerospace systems," Morris notes.
Astigmatism elimination
Raman microscopy systems made by Princeton Instruments (Acton, MA) take the modular approach to microspectroscopy, says Michael Case, the company's spectroscopy unit manager, adding that this allows researchers to select spectrographs, CCDs, accessories, and software optimized for their micro-Raman experiments. Associated equipment includes IsoPlane and SpectraPro imaging spectrographs, thermoelectric (TE) and liquid-nitrogen (LN)-cooled CCDs, Raman filter assemblies, and software.
The company's IsoPlane-160 spectrograph has an optical design developed at and patented by Princeton Instruments that incorporates a Schmidt corrector in the optical train to eliminate astigmatism, providing near-diffraction-limited imaging performance and thus high spectral resolution. "This makes it well suited for micro-Raman and microspectroscopy applications," Case says.
The IsoPlane-160 integrates with microscopes from various manufacturers, and allows acquisition of high-quality images and Raman spectra from a single spectroscopy system, Case notes. "High-quality images are important for identification of sample features for analysis," he adds. "And high spatial and spectral resolution improves system signal-to-noise performance for superior detection capabilities."
Combined with the PIXIS 400 CCD camera made by Princeton Instruments, Case notes that the IsoPlane-160 was recently used by researchers at Utah State University (Logan, UT) as integral components that transformed their existing fluorescence microscope into an affordable, flexible Raman microscope system.REFERENCE
1. D. B. Thomas et al., NatureSci. Rep., 4, 5226 (2014); doi:10.1038/srep05226.
For More Information
Companies mentioned in this article include:
BaySpec
San Jose, CA
www.bayspec.com
CRAIC Technologies
San Dimas, CA
www.microspectra.com
Ocean Optics
Dunedin, FL
www.oceanoptics.com
Princeton Instruments
Acton, MA
www.princetoninstruments.com
For a complete listing of companies making Raman microscopes, visit the Laser Focus World Buyers Guide (https://www.laserfocusworld.com/directory).
About the Author
John Wallace
Senior Technical Editor (1998-2022)
John Wallace was with Laser Focus World for nearly 25 years, retiring in late June 2022. He obtained a bachelor's degree in mechanical engineering and physics at Rutgers University and a master's in optical engineering at the University of Rochester. Before becoming an editor, John worked as an engineer at RCA, Exxon, Eastman Kodak, and GCA Corporation.
