ULTRAFAST TUNABLE LASERS: 2D infrared spectroscopy moves toward mainstream use
Two-dimensional infrared (2D IR) spectroscopy has many advantages over commonly used forms of IR spectroscopy. As an analytical tool, it can help identify compounds and disentangle mixtures. As a research tool, it can provide both kinetic and structural information, such as what is needed for research in biophysics, drug binding and membrane dynamics, and materials science—for example, organic LEDs (OLEDs) and organic photovoltaics.
Until very recently, the technique was characterized by daunting practical complexity, limiting its use to a small handful of specialized ultrafast laser-spectroscopy labs. The recent development of a user-friendly 2D IR instrument now makes 2D IR spectroscopy almost as routine as established techniques such as Fourier-transform IR (FTIR) or nuclear-magnetic-resonance (NMR) spectroscopies, unlocking its vast potential for a broad range of users.
What is 2D IR spectroscopy?
The predecessor to 2D IR spectroscopy is FTIR spectroscopy, which is currently one of the most widely used analytical and research tools in the world. FTIR spectroscopy is often the first tool that a researcher uses to analyze a new compound, check whether a chemical reaction has completed, or determine whether or not a molecule has bound to a surface.
Nearly every molecule that vibrates produces a characteristic IR absorption spectrum, and so FTIR has uses in fields as diverse as biophysics, materials science, energy sciences, and analytical chemistry. Catalogs have been compiled containing the FTIR spectra of thousands of molecules so that unknown compounds can be identified. However, one of the things that cannot be learned from FTIR is whether two absorption lines come from the same molecule or not.
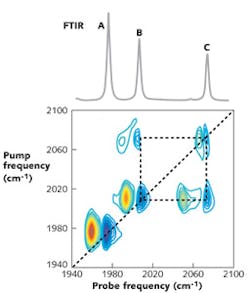
Consider the FTIR spectrum in Fig. 1 (top), which contains three peaks labeled A, B, and C. Are these three peaks all created by the same molecule? Or do they arise from the mixture of different types of molecules? Reference spectra can help, as can additional experiments, and often enough is known about the sample to eliminate some possibilities, but without further information, an FTIR spectrum cannot unequivocally answer this fundamental question.
Two-dimensional IR spectroscopy is able to answer this question, and many others, by providing a dynamic and 2D picture of how the absorption peaks are connected with each other.1 A typical 2D IR spectrum (see Fig. 1, bottom) is a 2D map in which molecular absorption is plotted as a function of two excitation frequencies covering the same wavelength (or wavenumber) range. The peaks observed along the diagonal line are similar to a conventional FTIR spectrum, while the off-diagonal structures (called cross-peaks) are created by the interactions or energy flow between vibrational energy levels. The dynamic evolution of the system, such as energy flow or chemical exchange, can be monitored by varying the time delay between the combination of pulses used to excite the sample.
Going back to the example of Fig. 1, each of the three peaks in the FTIR spectrum creates a diagonal pair of peaks in the 2D IR spectrum. The pairs of cross-peaks between B and C (connected by a square) indicates that these two absorbances arise from one species, while peak A, which is not connected by any cross-peaks, belongs to a second species. In fact, these experimental spectra were measured for a dilute mixture of tungsten hexacarbonyl [W(CO)6] and rhodium dicarbonyl (RDC) in acetone. W(CO)6 has a single absorption band at 1670 cm-1, whereas RDC has two absorption bands at 1990 and 2070 cm-1. Thus, the cross-peaks help disentangle the FTIR spectrum.
Where do these cross-peaks come from? The cross-peaks measure the coupling between vibrational modes.1 In the example above, modes B and C of RDC come from the stretches of the two carbonyl groups attached to the metal center. Because of their close proximity and because they share a common central atom (the metal), the vibrational motions of one carbonyl mode influences the motions of the other.2 That is what is meant by coupling. As a result, a cross-peak appears between the two.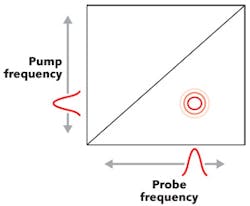
Cross-peaks can also occur between molecules if the vibrational modes of those molecules become intertwined, such as often occurs between hydrogen-bonded species, stacked aromatic ring systems (such as in DNA), and other sorts of structural arrangements such as protein secondary structures. Thus, like an FTIR spectrum, a 2D IR spectrum provides frequency and intensity information, but in addition also reveals the connectivity between bonds.
How does one collect a 2D IR spectrum?
The principles behind 2D IR spectroscopy are relatively straightforward. If two vibrational modes are coupled, excitation of one of those modes with a laser pulse should change the frequency of the other one. If that happens, there is a cross-peak. In fact, this is how the first 2D IR spectra were generated: the frequency of a tunable narrowband mid-IR laser pulse was scanned across the vibrational resonances while monitoring the absorption of a probe pulse.3 The change in absorption or optical density (ΔOD) was plotted as a function of the narrowband frequency to give probe and pump axes, respectively (see Fig. 2).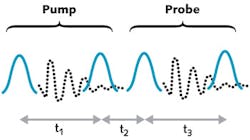
This frequency-domain approach of collecting 2D IR spectroscopy is still being used, although it is now largely being replaced by a time-domain version that is much more accurate. In the time-domain approach, the narrowband pulses in Fig. 2 are replaced with pairs of femtosecond pulses whose bandwidth covers all the vibrational modes at once.
Data are collected as a function of the time delays t1 and t3. The time-domain data are then processed by taking a Fourier transform to present the spectrum in a similar manner to how an FTIR instrument processes its interferograms. Instead of replacing the probe with a pair of pulses, it is also possible to use a single femtosecond pulse and a monochromator so as to optically produce the Fourier transform of the probe axis.
The time-domain approach is usually preferable to the frequency-domain approach because the narrowband pulses are picoseconds in duration, during which most molecules move and lose a substantial amount of their energy (see Fig. 3). Thus, the signal is stronger and the spectra more easily interpreted.
Implementing 2D IR spectroscopy using pulse shaping
In principle, what we have described above is straightforward to do experimentally, but in practice it has taken more than 10 years to learn the best and simplest ways of implementation. To implement the time-domain pulse sequence, one needs to generate four beams of femtosecond pulses, control their relative delays with accuracies of a few femtoseconds, focus them all into the sample at the same spot, and then direct the signal onto a detector. This process is even more difficult when considering that the laser beams are in the mid-IR, and thus invisible to the naked eye.
Building a spectrometer from scratch can take months for even the best experimentalist, and when assembled, if a single mirror is bumped, it can take days to get the signal back. A laser system that generates the mid-IR light is also critical, because high beam stability is mandatory to keep temporal and spatial overlap of these four pulses. Thus, the great potential of 2D IR spectroscopy has been hampered by experimental complexity.
A technique that combined the best of both worlds—femtosecond pulses with a simple optical layout—was invented a few years ago when the Zanni Research Group at the University of Wisconsin-Madison used femtosecond pulse shaping to collect a 2D IR spectrum.4 Femtosecond pulse shaping was invented nearly two decades ago; Martin Zanni built the first pulse shaper that operates in the mid-IR by using an acousto-optic modulator made of germanium.
Using this pulse shaper, his research group generated and scanned the time delay between the pairs of femtosecond pulses in Fig. 3 to generate a 2D IR data set. Moreover, they showed that spectra could be collected in a pump-probe beam geometry in which the two pump pulses (and probe pulses) are collinear, rather than having separate beam paths for each of the four pulses. Thus, their experimental design enabled computer-generated pulse sequences (similar to how an NMR spectrometer generates radio-frequency pulses) and reduced the number of laser beams from four to two.
It has become apparent over the past five years that this method offers many other advantages as well. The pulse shaper can update the time delay with every laser shot, eliminating the need for mechanical translation stages and resulting in faster data collection and a higher signal-to-noise ratio. The phases of the pulses can be cycled, allowing the background to be subtracted without chopping the laser beams; this effectively increases the repetition rate and allows scatter from heterogeneous samples to be removed. In addition, more sophisticated pulse sequences can be generated that enable mixed frequency/time-domain data collection and the coherent control of molecular vibrations, for example.
Reducing complexity
Not surprisingly, the complexity with which 2D IR spectrometers were originally built limited their use to a few specialty ultrafast-laser labs. Two key developments have combined to enable the development of user-friendly 2D IR spectrometers. First, the availability of intense and stable mid-IR laser sources such as the Libra, provided by Coherent: the Libra is a one-box integrated regenerative ultrafast amplifier that produces highly stable pulses at the millijoule energy level with less than 100 fs duration at kilohertz repetition rates.
The laser's output is directed into a pre-aligned optical parametric amplifier (OPA) such as the Coherent OPerA Solo (TOPAS), which generates femtosecond mid-IR pulses. These pulses span 150 cm-1 or more and are tunable over the 2.6–11 μm range. Thus, with computer-controlled software, the mid-IR pulses can be set to cover the vibrational modes of interest.
The other key development consisted of developing a similarly user-friendly 2D spectrometer. The 2DQuick, by PhaseTech Spectroscopy, is the first closed-box 2D IR spectrometer; it used pulse shaping technology from the Zanni Research Group discussed above.5 This instrument has two acousto-optic modulators, one to generate the pump pulses and the other the probe pulses.
By using two pulse shapers, either axis of the 2D IR spectrum can be collected in the frequency or time domains, and thus the best method of scanning can be selected based on the properties of the molecules. Moreover, phase cycling can be performed for either the pump or probe pulses, thereby optimizing background subtraction.
For most academic research groups it takes one or two years to build a 2D IR spectrometer, skilled laser experts to maintain it, and a deep knowledge of the nonlinear formalism to program the data-collection software. In contrast, 2DQuick collects a 2D IR spectrum in seconds and produces publication-quality data in just a few minutes for many molecular systems (averaging may be required, depending on signal strength for the molecule of interest). The software comes with a collection of standard pulse sequences used by the 2D IR community, or users can program their own pulse sequences. The spectral range of the standard instrument covers the 3–8 μm wavelength range, with other ranges available upon request.
This spectrometer enables a broad range of scientists to utilize 2D IR spectroscopy. For non-experts, it is a user-friendly blackbox. For spectroscopy experts, it enables them to easily implement their own custom-designed pulse sequences to explore new ideas. For instance, one could optimize a pulse sequence using concepts from coherent control to maximize vibrational excitation.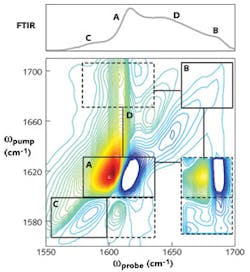
Example applications
Although in its relative infancy, 2D IR spectroscopy has already proven to be a powerful tool in delivering insights on some important scientific problems. In life sciences, for example, it is known that diseases such as Parkinson's, Type II diabetes, "mad cow" disease, and Alzheimer's, are associated with anomalous folding and/or aggregation behavior of amyloid proteins, specifically the way that these proteins stick together to form secondary structures such as β-sheets.
In another example, 2D IR spectra were used to characterize the fiber-formation kinetics of the human islet amyloid polypeptide (hIAPP) that is involved in type II diabetes.6 Spectroscopic markers were identified that uniquely monitor random coil versus β-sheet secondary structures, as well as probe β-sheet elongation and stacking (see Fig. 4). These measurements provided more rigorous kinetics for the secondary structure evolution of amyloid formation than is available with other techniques.
The 2D IR approach has also recently been used to study the influenza virus.7,8 Specifically, it was used to examine the pH-controlled m2 protein from influenza A that is a critical component of the virus, and serves as a target for the aminoadamantane anti-flu agents that block its proton channel activity. 2D IR data revealed that trans-membrane proteins undergo a very subtle, but specific, conformational shift when this channel is closed.
Many 2D IR researchers have been focusing on the structural dynamics of liquids and proteins, but materials-science applications are a promising new direction. In materials sciences, molecular conformations at organic/inorganic interfaces play a vital role in certain emerging technologies, ranging from solar cells to molecular electronics such as OLED displays. However, studying conformations of molecules adsorbed to materials is very difficult. 2D IR spectroscopy was used to identify three conformations of an organic dye on a titanium dioxide (TiO2) polycrystalline thin film, and monitored the electron injection kinetics for each.9 Electron transfer in polymer photovoltaics has also been studied.10
ACKNOWLEDGEMENT
All of the data shown in this article was collected using spectrometers at the University of Wisconsin-Madison that became the basis for the product called 2DQuick Array.
REFERENCES
1. P. Hamm and M. Zanni, Concepts and methods in 2D IR spectroscopy, Cambridge University Press, Cambridge, England (2011).
2. O. Golonzka et al., Phys. Rev. Lett., 86, 10, 2154 (2001).
3. P. Hamm et al., J. Phys. Chem. B, 102, 31, 6123 (1998).
4. S.-H. Shim et al., Proc. Nat. Acad. Sci., 104, 14197 (2007).
5. D. R. Skoff et al.,"Simplified and economical 2D IR spectrometer design using a dual acousto-optic modulator," Chemical Physics, in press.
6. D. B. Strasfeld et al., J. Am. Chem. Soc., 130, 6698 (2008).
7. A. Ghosh et al., Proc. Nat. Acad. Sci., 108, 6115 (2011); doi:10.1073/pnas.1103027108.
8. J. Manor et al., Structure, 17, 247 (2009).
9. W. Xiong et al., J. Am. Chem. Soc., 131, 18040 (2009).
10. L. W. Barbour et al., J. Phys. Chem. B, 110, 24281 (2006).
About the Author
Martin Zanni
Founder and President, PhaseTech Spectroscopy
Martin Zanni is Founder and President of PhaseTech Spectroscopy (Madison, WI).
Chris Middleton
Founder and Chief Technology Officer, PhaseTech Spectroscopy
Chris Middleton is Founder and Chief Technology Officer of PhaseTech Spectroscopy (Madison, WI).
Marco Arrigoni
Marco Arrigoni is vice president of marketing at Light Conversion (Vilnius, Lithuania). He previously served as director of marketing at Coherent (Santa Clara, CA) from 2007 through 2023.
Joseph Henrich
Senior Product Line Manager, Coherent
Joseph Henrich is senior product line manager at Coherent (Santa Clara, CA).