Vibration Control: Laser Doppler vibrometry brings vibrational dynamics to 14th century mechanics
MARTIN COCKRILL and MAX CHOWANIETZ
John Taylor & Co (Loughborough, England) can trace their foundry traditions back hundreds of years. As with most bell foundries, they rely on a ratio of dimensions that is unique to them—their own signature. However, one of the things that they had found in recent years was that their particular profile of bell did not lend itself well to making smaller bells, meaning that the ratio of notes that made up their sound did not quite hold true with the smaller bells compared to their larger cousins.
Rather than use trial and error to develop a new profile experimentally, they had the foresight to look to the rest of industry, which had moved much of engineering development into the virtual, digital world in recent years. Finite element (FE) modeling of structures is now almost a requirement rather than an optional extra step. It turns out that modeling, when aided by the principles of laser Doppler vibrometry, can be used to control the acoustic performance of bells and address other applications related to vibrating systems.
Natural frequency modes
One step that is often overlooked in the world of FE modeling is that of correlation. How do you determine that your model is an accurate representation of the physical world and can be used with confidence to make the engineering decisions that you need? This correlation step is vitally important to iron out any assumptions made by the modeler in regards to material properties used and in the manufacturing process.
This is especially true with structures made from more unusual materials, such as lightweight composites or, in this case, alloys. Bell metal is the traditional material (a higher tin version of bronze), but that is only a starting point—each foundry has their own recipe, so it makes sense to correlate the virtual model and resolve all those uncertainties in one go.
The best way to perform model correlation is to measure a structure's natural frequencies, often called Eigen frequencies or Eigenmodes, and compare those with the model in a process called modal analysis.
The natural frequencies of an object are the frequencies that it will tend to vibrate at if excited once and not subject to a continuous excitation. That is, they are a physical property of a structure that depends both on its geometry and on the material from which it is made.
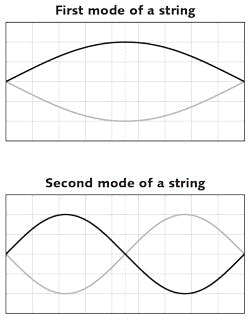
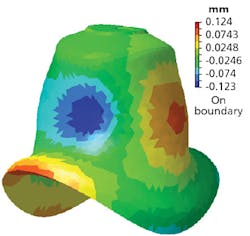
Each natural frequency will have its own characteristic pattern of physical distortion. For a simple two-dimensional (2D) example, a string fixed at both ends will have its first natural frequency at a note with a wavelength equal to half its physical length (see Fig. 1). Therefore, its mode shape would be called the first bending mode. Its second natural frequency would be at a note with wavelength equal to the physical length and this is called the second bending mode.
Depending on how the structure moves and how well it couples with the air around it, one may be able to hear the vibration—but not necessarily. For a bell, its entire geometry has been honed to couple with the air around it and make sound.
There are many theoretical approaches to define a mathematical model to understand the vibration of a structure or physical system. Experimental modal analysis is a process that creates a mathematical model based purely on test data derived from the response of a system to excitation.
Experimental modal analysis
The normal method of testing a structure to perform modal analysis involves applying a known excitation, measuring a response, and then doing this many times to build up a matrix of the entire structure. To be effective, some basic requirements must be true. First is reciprocity, whereby exciting a structure at A and measuring its response at B should be the same as exciting at B and measuring at A. Second, the system must be linear in response to an excitation: twice the excitation creates twice the response. Both of these requirements are true for a one-piece structure made from a single material such as a bell.
While excitation can be provided in a number of ways, the two most often used methods are either through an instrumented hammer or through an electrodynamic device called a shaker. A shaker is a moving coil device much like a domestic loudspeaker. However, instead of the coil moving a cone that in turn moves the air, it moves a short rod known as a stinger. The stinger is physically attached to the structure and provides a mechanical input for the test.
Both the instrumented hammer and the shaker system incorporate a small piezo-ceramic device called a force gauge through which the excitation is channeled, allowing the amount of force going into the structure to be quantified.
The most common way to measure the response of the structure is via an accelerometer—a piezo-ceramic device that gives a minute electrical charge directly proportional to its acceleration.
While accelerometers have a wide range of sizes, configurations, and robustness factors, they all have the same limitation: they are a physical device that needs to be attached to the structure under test and must be electrically connected to get their signal out. When measuring at multiple or even hundreds of points to get more detail on the structure and resolve more complicated and higher-frequency modes, weight and the cycle time of attaching the sensors and cabling begins to add up.
Why laser vibrometry?
Laser Doppler vibrometry (LDV) has been around since the late 1980s with a number of different commercial solutions. Polytec (Berlin, Germany) has been making laser-based instruments for more than 40 years. Traditionally, LDV is used in situations where the physical attachment of a sensor is difficult or impossible. However, LDV can also reduce the workload associated with vibration measurements and this process improvement is our primary interest at the University of Leicester.
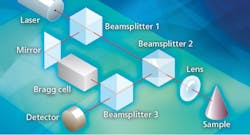
If a wave is reflected by a moving object, its frequency is shifted by an amount directly proportional to the object's velocity. If the wave is in fact a single-wavelength laser, the resultant change in frequency of light can be detected using the interferometer within a Polytec LDV system (see Fig. 2).At its simplest, the beam of a helium neon laser is split into a reference beam and a measurement beam. The measurement beam is focused on an object, reflects back to the instrument, and is combined with the reference beam in an interference pattern that is related to the path length difference between the two beams. The instrument also measures path-length changes for moving objects to compute velocity. For vibration measurement, this is not the global velocity of the object, but is the local velocity normal to the surface of the object that touches and drives the air into motion, creating sound.
Our scanning LDV system from Polytec uses servo mirrors to direct the laser from point to point within a measurement grid. While a single laser vibrometer measures the velocity of the surface of an object along the optical axis of the vibrometer, we use three independent vibrometers co-aligned to the same sampling point, but at different interrogation angles to determine the complete 3D velocity vector at a single point. These are often referred to as the x, y, and z velocities or the in-plane, across-plane, and out-of-plane velocities.
Unfortunately, it is not possible to see all points of a complicated curved structure from a single position. And while multiple measurements can be pieced together, it is very difficult to realign the system for multiple locations. Fortunately, modern LDV systems can be industrialized—with a robot moving the lasers around, rapid, repeatable, and efficient 3D measurements are possible from multiple locations. The robot arm provides feedback regarding its coordinates and allows the measurements to continue unattended 24/7.
Experimental modal testing
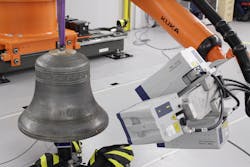
Vibrometry was put to the test in our laboratory using a free-supported Taylor bell (see Fig. 3). A shaker was attached to the inside of the bell, which was excited using a white-noise signal that contains random signals across the frequency range of interest. However, all the frequencies have an equal intensity.In keeping with the essence of modal analysis by exciting a structure and measuring its response, we quantified the excitation using a shaker attached to the bell by means of a force gauge glued to its inner surface and measuring the response of the bell using the robot-mounted LDV system.
Guided by the robot arm, the LDV system measures surface vibrations at multiple points on a section of the bell. The roving point is in actuality three laser points co-aligned to the same point, allowing the in-plane (x), across-plane (y), and out-of-plane (z) surface vibrations to be measured just as if you had placed a tri-axial accelerometer on the surface at that point. For each measured point, the equipment records a Frequency Response Function (FRF)—a transfer function of vibration response on the surface with respect to the input excitation.
Once all the points visible from one robot location have been measured, the robot moves to the next viewpoint location and the process starts again for all 4000 locations on the bell's surface and a matrix of transfer functions is gradually built up consisting of all x, y, and z surface vibrations.
From a process viewpoint, there is nothing unique about the data analysis approach. Our expertise is in the way we streamline the data-gathering process for 4000 individual vibration locations using the LDV technology.
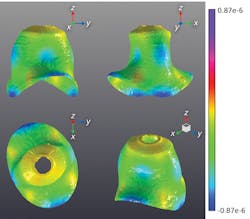
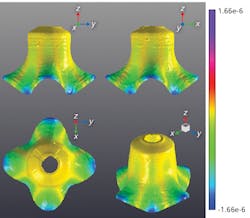
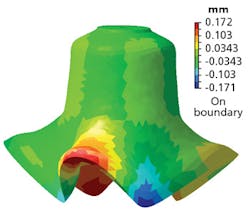
Essentially, the matrix of transfer functions is loaded into one of many commercially available modal analysis software suites. The solutions of this model are the natural bell frequencies combined with an animation that shows how the bell bends and twists at each natural frequency. Because a bell is a 3D structure and is free to have motion in all three dimensions at the same time, we were able to describe much higher natural frequencies than any other prior physical test because we could show how each one of the 4000 points contributed to the motion of the surface at each of the natural frequencies.
The same results can be obtained from FE modeling of the bell. A matrix of virtual transfer functions is calculated for the surface of the bell based on all the physical assumptions that the modeler has incorporated into their virtual model. The solutions of this virtual model are the same as the physical LDV data—a table of natural frequencies and the pattern of distortion on the bell that creates each one.By using robotized laser vibrometry rather than traditional methods, we were able to correlate a virtual model all the way through the required musical frequency range, giving the customer confidence in using the model to make future design changes and improvements.
Martin Cockrill is a technical specialist and Max Chowanietz is an engineer, both in the Advanced Structural Dynamics Evaluation Centre at the University of Leicester, Leicester, England; e-mail: [email protected]; https://le.ac.uk and http://asdec.co.
