Scientific Imaging: A guide to choosing and using scientific imaging cameras
STEPHANIE FULLERTON
In 1742, microscopist Henry Baker challenged his readers with the following statement: "When you employ the Microscope, shake off all Prejudice, nor harbor any favorite Opinions; for, if you do, tis not unlikely Fancy will betray you into Error, and make you see what you wish to see." Baker instinctively understood that seeing is perhaps too much believing, and images are not always an accurate reflection of reality.
Three centuries later, imaging has become integral to scientific research. The pictures we take through a microscope inspire and support hypotheses, provide data for funding, and enchant us in ways other data fail to do. As we rely on these images for our science we must remember Henry Baker's advice and take it one step further; that is, in addition to leaving our preconceptions behind, we must also make an effort to understand how the technology we use in the collection of the image data can affect the quality of the image itself.
The technical world of imaging products is swarming with specifications and acronyms. But it is possible to use common sense to cut through the babble of marketing material by remembering five basic principles for choosing and using a scientific imaging microscopy camera: (1) see with the brain; (2) think in photons; (3) more photons are better; (4) cameras are not perfect; and (5) know thyself.
See with the brain
Our eyes are fabulous detectors, but they are hardly quantitative. Part of a complex visual system that is wired to alter perception based on context, our eyes perceive bright things as appearing brighter in low-luminance situations such as a computer screen seen while traveling on a darkened airplane.
Although our eyes excel at distinguishing color and sensing movement and patterns and can theoretically detect about 1000 slight changes in gray levels, the monitors and displays we use limit the range of gray levels to 256 (8 bits). Even under ideal conditions with 10 bit monitors calibrated for brightness, our perception is limited to 700–800 gray levels.1 So how do we see with our brain? In part we can do this by understanding the detectors and displays that we use to capture and visualize images. Cameras are highly linear, can easily output > 4000 (12 bit) meaningful variations in gray, can be set up to detect a specific wavelength or a range of visible wavelengths, and can detect wavelengths outside what our visual system permits.
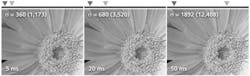
Thus, if our eyes can see a maximum of 800 shades of gray and our screens typically display 256 shades of gray, what can we do with the 4000 to 65,000 shades of gray captured by a digital camera? Ideally we use software to display the range of intensities that matter most to our applications. We also recognize that any image we are seeing is only a partial representation of the intensity range of that image data (see Fig. 1).
This may seem ridiculously simple, but just think for a minute about the last time a colleague shared an important image with you. Did you consider the settings or your environment? Do you know that you compared the sample and the control with matching parameters? Could you have missed an important piece of information that was seemingly lost in the shadows but in reality was just masked by the limitations of the display? Could an image that was deemed highly revelatory be misleading because it was simply scaled to be bright?
Raw images on screen should be visualized at a variety of different settings, and quality imaging software enables this scalability without altering the underlying image. There is no one correct way to display images. But images from the same camera that are being compared should be matched and images that are printed or compressed to say a .jpg file and displayed should provide commentary on how they are scaled. Images from different cameras cannot be compared without first understanding the units in the image, which brings us to the next basic imaging principle to remember when selecting a microscopy camera.
Think in photons
Read through any recent scientific publication and you'll see image intensities discussed as "AUs" (arbitrary units), "DNs" (digital numbers), "ADUs" (analog-to-digital units), or "gray levels." Read any camera data sheet and you'll see a collection of specifications related to electrons. What do arbitrary units and electrons have to do with detecting and quantifying photons!? Name any other quantitative science that can get away with discussing the data in arbitrary units or provide a proxy measurement (electrons) that varies across a wide range of experimental conditions (wavelength)!?
The historical context for this incongruity is that cameras are the products of electrical engineers who measure noise in electrical units and image highly regular test patterns with uniform and predictable luminosity. So when was the last time your sample looked like little boxes neatly lined up in a row with uniform intensity?
A by-product of electrical engineering is that read noise is expressed as electrons root mean squared (e- rms). Dark current is defined as electrons per pixel per second (e-/p/s). Each of these values can be converted to photons simply by applying the camera's quantum efficiency for the wavelength observed. Similarly, an ADU of a pixel can be converted to photons in two steps. First convert to electrons by applying the appropriate gain conversion factor, then divide by the quantum efficiency for that wavelength (see Fig. 2).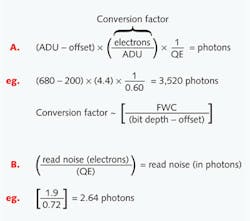
Why does this matter? Converting to photons provides valuable insight into the nature of your sample (and background) by defining your image data in something other than arbitrary units. Having the typical intensity value (or range of values) of your sample is critical for evaluating which camera provides the most quantitatively accurate and precise data for your application. Furthermore, understanding the pixel photon level is the only way to fully assess if differences in intensities among pixels are meaningful or merely a product of camera or photon (shot) noise.
More is better
Hamamatsu prides itself on building devices that achieve the lowest possible noise while maintaining speed and image quality. All camera manufacturers make proclamations of low-noise performance and debate the best way to measure camera noise. In reality, camera noise is often not the limiting noise factor in life science imaging. What is often overlooked is that photon signals have noise.
Due to the discrete nature of photons, any measurement of them has some uncertainty. This uncertainty—or noise—is defined as the square root of the signal. Thus, a signal of 10 photons has 3.16 photons of noise and a signal of 1000 has 31.6. Although more signal has inherently more noise, the proportion of noise relative to signal decreases with increasing photon number, thereby improving your signal-to-noise ratio. A pixel is said to be "shot-noise limited" when the noise from photons exceeds the total camera noise.
All of this jargon comes down to the best practice that says, when possible, collect more photons from your sample (typically by taking a longer exposure or increasing the light) to get the best images. Unfortunately, temporal issues such as a rapidly moving sample or dynamic changes in intensity or concerns of phototoxicity/photobleaching from intense or repeated exposure to light create circumstances such that collecting more photons is not possible or practical. When the experimental paradigm prevents the luxury of having lots of photons, then the noise performance of the camera especially matters.
Cameras are not perfect
Every camera has noise. Each type of camera technology, whether CCD (charge-coupled device), EMCCD (electron multiplying CCD), or sCMOS (scientific complementary metal-oxide sensor), introduces noise into the image in different but comparable ways. Each camera also has a 'sweet spot' where the performance of the camera is least affected by noise and the resulting image is close to the theoretical limits of that camera (but still never perfect).
Speaking in such generalities does not create a clear picture of why paying attention to noise matters. Let's take for example an EMCCD camera. Introduced in 2002 and offering the first real option for high-speed, low-light imaging, EMCCD cameras can provide the best SNR in extreme low-light situations (<6–10 photons per pixel, depending on wavelength); however, they are not the best cameras at higher light levels.
The reason for this seeming inconsistency is that the electron multiplying register of the camera adds an additional noise source that effectively multiplies the noise by 1.4. When the signal is high (and cameras don't distinguish between the actual signal and the background signal), this excess noise factor becomes a dominant player in noise equations. Unfortunately, many scientists still assume that EMCCD is the "most sensitive" camera and therefore the camera of choice for fluorescence applications. Experienced imagers know that previously CCDs and now high-quantum-efficiency (high-QE) sCMOS cameras provide better images with more signal to noise, dynamic range, field of view, and spatial resolution than an EMCCD under many conditions.
In addition, sCMOS camera speeds exceed those of EMCCD and CCD cameras. For all these reasons, high-QE, gen II sCMOS types are becoming the camera of choice for cutting-edge applications such as light-sheet microscopy and single-molecule precision localization.2,3
Know thyself
Although it appears last on the list, the very first question any scientist should ask when approaching a new camera purchase or conducting a new series of imaging experiments is "What am I trying to do?" Do I want beautiful pictures of fixed cells? Do I need to measure rapid calcium dynamics at a particular temporal resolution? Do I need to measure the distance between two cellular components? Do I need to count every cell in the field of view of the microscope? By asking and answering such questions in a systematic way, it is possible to choose an appropriate camera or to operate your existing camera with appropriate tradeoffs in the settings.
If rapid calcium dynamics is your objective, then your priority for choosing and running the camera is likely speed, and this could be achieved by sacrificing spatial resolution through binning or field of view by windowing. If routine fluorescence imaging is your goal and you are already using an EMCCD, then judicious use of EMCCD gain, rather than max gain, will actually improve your SNR and dynamic range. If spinning-disk confocal microscopy is your technique of choice, carefully consider if spatial resolution is crucial to your application. Although EMCCD sensors with big pixels are often the standard for spinning-disk imaging, high-quantum-efficiency (high-QE) generation II (GenII) sCMOS cameras offer performance advantages such as speed and field of view for all but the lowest-light-level samples.
Precision localization microscopy represents the apex of cutting-edge super-resolution techniques. Even in this rigorous field, knowing the exact nature of the sample in question is critical to choosing the appropriate camera, and there is no one perfect camera. Depending on required speed and molecular signal strength, each of the three standard imaging cameras—back-thinned CCD, EMCCD, and high-QE GenII sCMOS—all have a place (see Fig. 3).4,5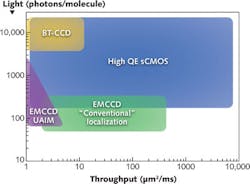
Imaging technology and biological insight is a feed-forward cycle. Technical advances open doors to better understanding of the inner working of living things. Applying a little common sense to every imaging experiment, regardless of the technology, can both enhance the quality of the data acquired and our visual experience of its splendor.
REFERENCES
1. T. Kimpe and T. Toytschaever, J. Digit. Imaging, 20, 4, 422–432 (2007).
2. M. B. Ahrens et al., Nat. Meth., 10, 5, 413–420 (2013).
3. F. Huang et al., Nat. Meth., 10, 7, 635–638 (2013).
4. Z. L. Huang, Opt. Exp., 19, 19156–19168 (2011).
5. J. Chao et al., Nat. Meth., 10, 4, 335–338 (2013).
Stephanie Fullerton is sales and marketing manager for camera products at Hamamatsu, 360 Foothill Road, Bridgewater NJ 08807-2932; e-mail: [email protected]; www.thelivingimage.hamamatsu.com.