JOHN FILHABER
When it comes to high-performance optical systems, mid-spatial-frequency (MSF) errors can affect applications in a wide variety of ways. For example, when present in cinematography optics, MSF errors can dramatically affect the quality of the "bokeh," especially when the MSF is present on aspheres (bokeh is the esthetic quality of an out-of-focus blur). In high-resolution surveillance systems, MSF errors can degrade overall image contrast.
Yet, for many high-performance systems being deployed today, MSF errors are either trivialized or simply overlooked. Even when MSF concerns are identified, the modeling challenge for most designers can be daunting without specific knowledge of the manufacturing process. For example, while many opticians are familiar with the characteristic MSF "fingerprint" in their polishing process, they rarely isolate the data in such a way that designers can incorporate it in their tolerancing.
To understand the impact and causes of MSF errors, we first need to describe the surface in terms of its frequency content. To do this, we use Fourier analysis to "sort out" the surface by frequency content. The result is then plotted as a power-spectral-density (PSD) plot. The power in a specific frequency "bin" in units of l2l (l = length) is plotted against spatial frequency in units of l-1.
At the low-frequency end of the plot are errors typically described by terms such as figure, power, irregularity, or Zernike polynomial specifications. At the high-frequency end are errors usually described by surface-roughness specifications such as Ra (arithmetic average of the absolute values) and Rq (root-mean-square value). Errors with frequencies in between are variously called MSF, ripple, waviness, smoothness, or slope error. While definitions vary, for the audience in the theater or the analyst reviewing battle imagery to obtain the strongest possible image contrast, depth, and dimension, the entire spectrum of errors must be considered by designers and manufacturers to understand and control performance of an optical system.
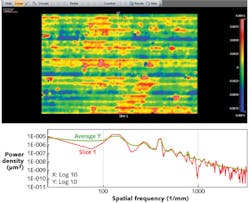
Figure 1 shows a PSD plot from a 3D optical-profiler (Zygo Corporation's NewView) measurement of a diamond-turned surface. The calculated root-mean-square (RMS) error and the Ra of the surface at 1.8 nm and 1.3 nm are consistent with a 2.0 nm RMS roughness requirement. The PSD of the surface in the y (long) direction gives a more-detailed picture of the surface. The frequencies shown correspond to periods from 100 μm to 0.5 μm. There is a clear peak at 250 mm that corresponds to the diamond-tool feed rate of 4 μm per turn.
Impact of MSF on performance
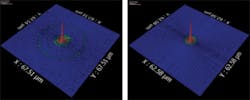
Surface errors affect optical performance in different ways depending on their frequency content, operational wavelength, and location in a system. The performance impact of an error at a given frequency is a way to define the boundaries between the low, medium, and high spatial frequencies. Low-spatial-frequency errors—such as power, astigmatism, and coma and those described by Zernike polynomials through Z36—broaden the point-spread function (PSF) of a system. High-spatial-frequency errors scatter light at high angles either out of a system or into a system. MSF errors impact a different regime, scattering light out of the core of the PSF without changing its shape, but at angles small enough to illuminate the focal plane—resulting in effects like hazing, subtle reduction of the range of shades in dark areas of an image, or uneven texture in out-of-focus portions of an image. Figure 2 shows a surface with and without MSF errors and their impact on the PSF.A detailed analysis of MSF error's influence on system performance is beyond the scope of this article but can be found in the references at the end of the article. A few useful oversimplifications will provide some visibility into the scale and form of the impact. Parameters such as modulation transfer function (MTF) depend, among other things, on the angle into which the MSF error scatters the light. An estimate of the scatter angle, θ, can be had from the grating equation, θ = arcsin (λ/d - sin θi), where θi is the incident angle, d is the period of the grating (or in this case, of the surface error), and λ is the operating wavelength of the system. From this we can see that light will be diffracted away from the core of a PSF by an angle that is a function of the wavelength of the system, and spatial frequency (f = 1/d) of the grating, or in our case, the error.
In the case of regular errors like diamond-turning tool marks or the print-through of the structure of a lightweighted mirror, this approximation works quite well. For more random errors, the scattering pattern is not regular, but the grating equation still gives good guidance as to where the light will wind up. In the example in Fig. 1, the tool marks from the diamond tool would scatter light at an angle of about 7° in the visible. In a wide-field imaging system, this surface, if uncorrected, would put objectionable rainbows around bright objects that a pitch-polished surface would not.
The high-frequency limit of MSF may be set by the point where the scattering angle approaches the aperture of the system. The regime beyond this limit is commonly described as surface roughness. At that point, the impact on the system is global and contributes to the veiling glare of a system.
The reduction of the intensity of the core of the PSF relative to the peak intensity of the diffraction-limited PSF is called the Strehl ratio, or simply Strehl. For small errors, the impact on Strehl can be approximated by the equation:
A good approximation of the total integrated scatter (TIS) is TIS ≈ (4πσ/λ)2. From this it is immediately apparent that a surface in an extreme-ultraviolet (EUV) lithography system operating at 13.5 nm would scatter 200X more energy than an equivalent surface used in an immersion lithography system at 193 nm.
MSF in design
For the most-demanding applications, the optical designer's goal—defining and specifying high-quality, manufacturable optical assemblies—has been hampered by a failure to acknowledge the consequences of MSF when moving away from full-aperture pitch polishing to fast, modern machined optics. Taking note of MSF within the design and specifying the surface tolerance for the frequency are now important.
During the design of an optical system or element, MSF errors are usually considered in tolerancing since the design wavefront is controlled with low-frequency terms such as radius and a handful of coefficients for general-asphere terms or Zernike polynomials. In this sense, spatial frequencies higher than those that are represented by the first Zernikes (approximately 5 cycles across an imaging aperture) may be a reasonable lower limit to MSF.
Optical-design software includes capabilities for modeling scatter in a system and its impact on MTF and other parameters. Code V (Synopsys; Mountain View, CA) and Zemax (Radiant Zemax; Redmond, WA), for instance, include several scattering functions that can be attached to a surface and then evaluated using nonsequential ray-tracing and image-analysis tools.
The size of the subaperture that is illuminated by a point on an object is a key parameter when estimating error contributions to system performance. As an example, a lens with a clear aperture of 50 mm and MSF errors with 0.2/mm range will behave differently depending on the size of the illuminated subaperture. If this lens is at the pupil, the entire surface will contribute a wavefront aberration of approximately 10 cycles across the aperture. Light will be predominantly scattered on the order of 30 arcsec from the core of the image while the PSF will remain intact. At a window near the focal plane where the imaging bundle may be 2 mm in diameter, the spatial periods are a few times larger than the subaperture; the main consequence would be tilt or a shift of the image contributing to distortion.
Specifying MSF
The specifications of the elements in an optical system should completely guarantee that the systems assembled from these components will meet all of the user's requirements. It is the design engineer's first task to "flow down" the requirements to specifications that the manufacturer can understand, measure, and control. Indicating only the traditional radius, power, irregularity, and roughness specifications is clearly not enough to guarantee high performance from even a spherical surface. Point-spread function may be achieved, but Strehl, encircled energy, MTF, and flare will not be constrained.
To have the greatest degree of artistic control over the final image, editors and directors of photography are asking for better lens assemblies from manufacturers, but typically describe the effects qualitatively, because of a lack of exposure to specifications that affect these image features. Delivering the full range of the director of photography's vision requires a much more detailed set of parameters than limiting resolution and MTF. Specifying the lens elements themselves needs more detail as well, since a cinematography lens with poor MSF but otherwise good power, figure, and roughness will produce distracting patterns in the out-of-focus portions of an image and apparent loss of contrast as light scattered from bright objects in the field obscures details in shadows that the eye would otherwise be able to detect.
ISO 10110-8, the International Organization for Standardization's optics and photonics drawing standards pertaining to surface texture (roughness and waviness), provides several methods and standard notation for specifying limits on MSF content. The simplest is RMS waviness, or Wq. The drawing callout is simply:
where Wq is the RMS waviness between C and D, the upper and lower limits of the spatial bandwidth. Including sampling length is an improvement over a one-number RMS specification, but still falls short of constraining the relative frequency content of the MSF errors. Because the error in the evaluation range is integrated and compared to a single value, a surface whose frequency content is smooth may have the same RMS value as one that has a strong but narrow peak. This will often lead to undesirable artifacts in performance, ranging from reduced MTF to ghost images from very regular periodic defects.
ISO 10110-8 also defines a more-complete specification using the PSD that allows control of the frequency content of the MSF errors as well. The PSD drawing callout sets a two-term upper limit for the PSD with the equation: PSD(f) = A/fB, where A is the height of the line and B is the slope (as before, C and D are the lower and upper limits of the spatial bandwidth):
In the event that no spatial bandwidth is specified, it is assumed to be 0.08 mm to 2.5 mm.
Manufacturing implications
Computer control and a small tool-contact area are key components of high-end optical manufacturing (especially for aspheres) and also the key contributors to the MSF fingerprint that they leave behind. With any computer-controlled polishing (CCP) method including small tool, ion-beam polishing (IBF), and magnetorheological finishing (MRF), special care and control of MSF errors is fundamental.
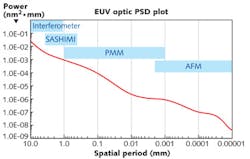
An example of MSF control in manufacturing a high-performance asphere is shown in Fig. 3. The PSD plot shows excellent performance across a dynamic range spanning six orders of magnitude.MSF errors are not the realm of aspheres alone. MSF is of little concern on systems with all spherical lenses that are polished with full-aperture pitch tools. Small tool-contact areas, however, leave small-period errors behind. Automated, flexible, and high-volume spherical-lens production equipment has forced us to rewrite specifications to control regular and irregular patterns that are residuals of the tools and control errors in the equipment used.
Measuring MSF
Complete measurement of a surface from low-frequency to high-frequency errors requires a suite of instrumentation to determine the full range of surface features that influence performance in the many regimes in which a system is evaluated. The test equipment used must have a sampling bandwidth and instrument transfer function (ITF = [PSDmeasured/PSDideal]1/2) sufficient to detect and accurately characterize the errors being measured.
The bandwidth and the ITF of an instrument are driven by a few factors—namely, sampling and optical design. Sampling is simply the density of data points that are projected on a surface. This sets a lower limit for spatial periods that can be measured across an aperture. For instance, a conventional large-aperture Fizeau interferometer with a 1K × 1K camera measuring a 1-m-diameter mirror will sample the surface with 1 mm spacing. The spatial-frequency cutoff for this system is driven by the Nyquist limit—in this case twice the sampling period, or 2 mm. The optical design and quality of the optics in the instrument set a further limit on the ITF since a large blur spot will mask all smaller features regardless of the number of pixels in the camera.
Building an instrument with excellent frequency response places a high bar on design, algorithm, and fabrication technologies. Figure 5 shows the measured ITF of a DynaFiz interferometer with a 1200 × 1200 camera through its range of zooms on a 100 mm part. At all zooms, the ½ Nyquist ITF remains 90% of the theoretical (90%) limit.Typically, a Fizeau interferometer will be used for the lowest-frequency measurements and a scanning white-light interferometer (SWLI) microscope will be used for the high-frequency measurements. MSF errors may span most of the measuring range of both instruments.
An SWLI microscope is typically used to continue the measurement spectrum from the high-frequency limit of the Fizeau to the limit of the roughness specification. For example, the NewView 7300 optical profiler, with a 1K × 1K camera, a 2.5X objective, and a 1X zoom tube, would overlap the sampling range in the previous example and extend the Nyquist-limited sampling down to 8 μm periods. Switching to a 20X objective will lower the Nyquist sampling limit to 1 μm. The diffraction limit of this objective is 0.7 μm, so in this case the Nyquist sampling limit will be twice that, or 1.4 μm.
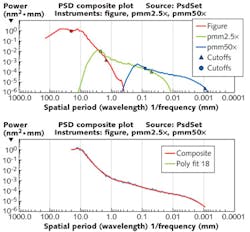
Custom metrology instruments are sometimes required to support extreme performance programs. Figure 6 shows the measured ITF of a custom SWLI system developed for semiconductor lithography. The customer needed to verify optics with a 0.1 nm RMS (4–400 cycles/mm) specification. The flowed-down instrument requirement of ITF greater than 70% at 400 cycles/mm was surpassed by the system.Measurement control and analysis software can collect and immediately display the data as a PSD and make it available for other types of analysis. The entire frequency range of data from several instruments and measurements can be combined into a single plot that allows direct evaluation of imaging performance over the entire frequency range of errors on a surface. In one example (see Fig. 6), data from a large-aperture interferometer is combined with two measurements from a SWLI microscope to provide a PSD spanning four decades of spatial periods from 20 mm to 1 μm.
The old saw, "Beauty is in the eye of the beholder," certainly applies to MSF considerations. What would be perceived as MSF for meter-class optics could easily be interpreted as a low-order error for smaller components. Similarly, artifacts like diamond-turning marks on a longwave-infrared lens might be deemed "smooth" for its application and wavelength, but would be judged unacceptable in another usage. As we strive for optimal results in our diverse optical assemblies, it is important for all stakeholders in an optical element to become knowledgeable about MSF considerations. The designer needs to properly specify optics. The manufacturer must ensure these specifications can be met. And to measure them, the metrologist must understand the true capabilities of the applicable instruments.
ACKNOWLEDGEMENT
Zygo, NewView, and DynaFiz are trademarks of Zygo Corporation.
REFERENCES
1. ISO 10110-8:2010(E), Optics and photonics — Preparation of drawings for optical elements and systems — Part 8: Surface texture; roughness and waviness 4.3.
2. P. Croce and L. Prod'Homme, Opt. Comm., 20–24 (October 1980).
3. J. M. Tamkin, T. D. Milster, and W. Dallas, Appl. Opt., 49, 25, 4825 (September 2010).
4. J. M. Tamkin, W. J. Dallas, and T. D. Milster, Appl. Opt., 49, 25, 4814 (September 1, 2010).
5. R. N. Youngworth and B. D. Stone, Appl. Opt., 39, 13, 2198 (May 1, 2000).
6. "High performance Fizeau and scanning white-light interferometers for mid-spatial frequency optical testing of free-form optics," Leslie L. Deck and Chris Evans, Zygo Corporation, Laurel Brook Road, Middlefield, CT 06455.
7. "Advanced Metrology Tools Applied for Lithography Optics Fabrication and Testing," Masaru Ohtsuka Production Engineering Research Lab, Canon Inc., Optical Fabrication & Testing (October 11, 2006).
John Filhaber is Director of Special Projects at Zygo Corporation, Middlefield, CT; e-mail: [email protected];www.zygo.com.


![FIGURE 5. The ITF of an DynaFiz instrument developed for semiconductor lithography is >70% at 400 cycles/mm for both horizontal and vertical lines [7]. FIGURE 5. The ITF of an DynaFiz instrument developed for semiconductor lithography is >70% at 400 cycles/mm for both horizontal and vertical lines [7].](https://img.laserfocusworld.com/files/base/ebm/lfw/image/2016/01/1308lfw05f5.png?auto=format,compress&fit=max&q=45&h=194&height=194&w=250&width=250)
