PHOTOVOLTAICS: Raman spectroscopy monitors thin-film Si PV cell manufacture
RONIAN SIEW
Raman spectroscopy is widely used to characterize the chemical composition of materials and substances; its applications range from forensics and pharmaceuticals to astrospectroscopy and many others. One interesting example is the manufacture of photovoltaic (PV) cells. Commercial PV cells can have a solar-to-electric conversion efficiency of up to approximately 17% to 18%. During the production of PV cells, it becomes necessary to monitor the quality of the cells such that maximum conversion efficiency is achieved. Raman spectroscopy is one such technique well suited to the task.
Spontaneous Raman scattering is feeble
In Raman spectroscopy, the material under examination is illuminated by light at frequency νo, and the resulting Raman scattered light is collected and analyzed in a spectrometer. Suppose that the characteristic energy of a molecular vibration unique to the material under examination is hν, where h is Planck's constant. Since the energy of the incident photon and Raman scattered photon is hνo and hνs, respectively, conservation of energy requires that hν = hνo - hνs.
Since c = νλ where c is the speed of light, we may recast the energy conservation equality in wavelength terms as ν = c[(1/λo) -(1/λs)]. The characteristic material vibration ν is often reported in terms of its equivalent reciprocal wavelength or "wave number," defined as 1/λ = ν/c = u.1 The wave number "u" for the material under examination is also referred to as the material's Raman shift, and a plot of the spectrum S(u) yields its Raman shift spectrum. For these reasons, material Raman shifts in Raman spectroscopy are often expressed as:
u = (1/λo) - (1/λs)
In wavelength space, the shift in photon wavelength is Δλ = λs -λo, and solving for Δλ yields:
Δλ = λo2[(1/u) - λo]-1
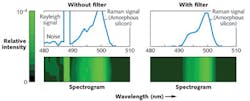
Unfortunately, not all of the scattered light from a material consists of wavelength-shifted Raman photons. Under conditions of thermal equilibrium, spontaneous re-emission of incident electromagnetic radiation results in Rayleigh scattering, Brillouin scattering, and spontaneous Raman scattering.2 The intensity of Rayleigh-scattered light (which consists of photons at the original illumination source frequency νo) is often many orders of magnitude greater than that of Raman scattered light.
As a result, observation of Raman-scattered light requires optical filtering to block out stray light from Rayleigh scattering.3 Moreover, due to the rather isotropic nature of Raman scattering, the fraction of photons collected by an optical system are spread out over a finite solid angle, requiring optical filters with optimal performance over a range of incident angles. These challenges are present in any application involving the use of Raman spectroscopy.
Observing Raman shifts from PV cells
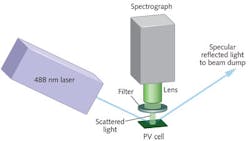
Photovoltaic cells based on Si come in both bulk and thin-film forms. Thin-film PV cells, which consist of Si deposited onto glass or silicon carbide, contain amorphous as well as microcrystalline Si, with the relative proportion of these two components being critical to the cell's conversion efficiency. As a result, the manufacture of efficient thin-film Si PV cells requires the ability to monitor these proportions during fabrication. Because both forms of Si have unique Raman spectral shifts, Raman spectroscopy can be used for their detection (see Fig. 1).4,5
In one example, a laser source emitting at λo = 488 nm strikes a sample containing amorphous Si, producing scattered light that is collected by a lens over a solid angle Ω = 0.024 steradians (5° half-cone angle). As noted before, a filter is required to block the Rayleigh scattered light at the laser wavelength. A case can be made to mount this filter in front of the lens rather than in collimated space behind the lens to prevent the possibility of stray reflections of the Rayleigh scattered light within the lens assembly. The remaining Raman scattered light is then collimated by the lens and fed into a spectrometer with a camera.
To appreciate the practical function of the blocking filter, consider a high-performance longpass edge filter, for example, from Semrock (Rochester, NY; a unit of Idex Corporation). The company produces application-specific standard filters for Raman spectroscopy, which are paired with ASCII files (downloadable from the Web site) containing measured filter transmission data in both wavelength space (nm) and wavenumber space (cm-1), enabling simulations to be performed prior to an actual experiment. An online user tool (called MyLight) can be used to model the performance of the measured filter data upon changes in various conditions such as angle of incidence or total cone angle of the light passing through the filter.
In one example, a downloaded ASCII data file for the filter "488 nm RazorEdge ultrasteep long-pass edge filter (part number LP02-488RE-25)" is opened up as a spreadsheet to use the data as a model filter with transmission T(λ) for a simulation and analysis. We expect the Raman shift spectrum from amorphous Si to appear like the plot shown in Refs. 4 and 5, with a peak intensity centered at the Raman shift of u = 480 cm-1.
Because most people are accustomed to visualizing spectra in wavelength space, the simulations will be performed in terms of λ. If L(λ) is the Rayleigh-scattered laser spectrum centered at λo, α is the peak intensity of the Raman-scattered light relative to the laser's scattered intensity, and S(λ) is the scattered laser light spectrum (in wavelength space) arising from Raman shifts (u), then S(λ) = αL(λ + Δλ). The spectrum S(λ) may be simulated by taking an approximate reading of the relative intensity values for the Raman shift spectrum of amorphous Si from Refs. 4 and 5, and converting them into wavelength space using the second equation.
Efficiently blocking Rayleigh scattering
Doing this, peak normalized plots for L(λ), S(λ), and downloaded ASCII data for T(λ) are shown in Figure 2 at incident half-cone angles of 0° and 5°. Note the steepness of the measured filter transmission within the scales displayed on the horizontal axis, implying that this filter would be a good choice for use in a Raman spectrometer.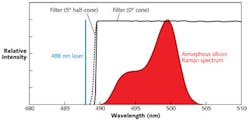
If the photovoltaic material consisted of both crystalline and amorphous Si, then a superposition of the two scattered Raman shift spectra would be observed at a detector. To distinguish between the two, a mathematical algorithm can be written to deconvolve the two spectra, yielding the desired individual Raman shift spectra. Finally, because thermal and other related stress in Si can alter the Raman shifts as well as reduce conversion efficiency of high-performance filters used in Raman spectroscopy, they may also be used for semi-quantitative characterization of the quality of PV cells.
The application of Raman spectroscopy to the inspection of PV cells is one of the ways in which photonics is contributing to efforts in energy conservation and environmental preservation. As demonstrated by the above simulation, the use of high-performance optical filters is helping to make such applications more practical.
ACKNOWLEDGEMENTS
Thanks to Turan Erdogan, Amanda MacDonald, and Jim Passalugo at Semrock (Rochester, NY) for helpful comments and suggestions to the original manuscript.
REFERENCES
1. J. R. Ferraro et al., Introductory Raman Spectroscopy, 2nd Ed., Academic Press, 3–4 (2003).
2. R. W. Boyd, Nonlinear Optics, Academic Press, 287–288 (1992).
3. T. Erdogan and V. Mizrahi, "Thin Film Filters for Raman Spectroscopy," Spectroscopy (Dec. 2004); http://bit.ly/Y9um2X.
4. T. Deschaines et al., "Characterization of Amorphous and Microcrystalline Silicon using Raman Spectroscopy," Application Note from Thermo Scientific; http://bit.ly/16jAZVc.
5. Semrock application note on Raman spectroscopy for photovoltaic cell inspection; http://bit.ly/ZygsZd.
Ronian Siew is the founder and chief optical engineer of Integrated Optical Solutions, Singapore; email: [email protected]; www.inopticalsolutions.com.