KEVIN KIRKHAM
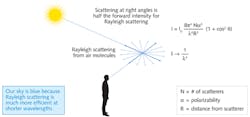
John William Strutt was born on Nov. 12, 1842, in Essex, England. His father was the second Baron of Rayleigh, and upon his death, Strutt became the third Baron of Rayleigh. In 1871, Lord Rayleigh explained that the sky was blue because shorter wavelengths of light are more easily scattered by the gas molecules that make up our atmosphere (see Fig. 1). Longer wavelengths are similarly scattered but at a statistically lower amount (inversely proportional to the fourth power of the wavelength).
Lord Rayleigh could not have predicted the uses of the scattering phenomenon he described; Rayleigh scattering has shown to be an excellent way to monitor the performance of high-power lasers and the optical delivery systems used to bring the beams to the workpiece.
Since the early 1960s, the fiber laser has held the promise of an inexpensive coherent light source that can easily be brought to the workpiece. These workpieces can now include the human eye (via laser surgery), a sheet of steel (via industrial laser cutting and welding) or an enemy rocket (via military lasers now in development), among countless others.
With the advent of cladding pumping, ytterbium (Yb)-doped fibers, and high-power/high-brightness diodes, modern high-power fiber lasers have become an impressive reality. Fiber-laser architecture is modular, permitting a near-limitless amount of total power to be realized by combining the output of multiple modules. In one example, IPG Photonics (Oxford, MA) recently installed a record 100 kW materials-processing fiber laser for Japanese joining technology supplier NADEX (Nagoya City, Japan).
Measuring high-power lasers
All laser processes benefit from the use of diagnostic equipment, if only to assure the operator that the laser and laser beam delivery components are still operating as expected. Of course, the ability to effectively monitor any process is a necessary precursor to mastering that process.
More and more applications require fiber-laser parameters to be optimized and consistent. Predictable and desired outcomes can be better assured by providing accurate, repeatable laser performance to the workpiece. Parameters important for efficient laser processing of the product or process include: beam intensity, waist size, and waist location of the X, Y, Z process volume. Most important is the ability to provide stable processing profiles of these measurements over time.
Compounded laser measurements, such as beam quality (m2) and beam parameter product (BPP), are other ways of defining or predicting the primary laser-processing parameter, which is spot brightness. Commercial beam-monitoring systems use beamsplitters, waveguides, or scanning slits to sample and attenuate high-power lasers.
While these systems are practical in that they use these sampling techniques to effectively match the sampled laser-beam intensity to the usable range of the profiling sensor, the sampling techniques add some distortion and uncertainty to the measurement data. Traditional diagnostic techniques measure one or two parameters at once, providing a myopic view of laser performance and argue the need for a number of diagnostic tools to be used sequentially or in tandem.
Laser-beam diagnostics have always included a way to measure the intensity of the beam—either the average power or the energy of each laser pulse. This is accomplished using thermopile and quantum-type sensors to measure the average power or with pyroelectric sensors to measure the energy per pulse.
More recently, ways to monitor the laser mode or beam profile have become available to provide greater knowledge of the laser system's performance to the operator. These systems consist of scanning-slit or CCD/CMOS-camera sensors that measure the beam's 1D or 2D intensity distribution. These systems are also capable of measuring the location of the focused spot or minimized beam in the processing zone. Optimally, beam-profiling systems should indicate how the power density changes across the area of the focused spot.
More complex systems that measure M2, BPP, divergence, and mode-field diameter are now available. These systems are based on beam profilers that can translate the spatial-measurement setup along the beam-propagation axis. This results in a more complete understanding of laser performance. This toolbox approach to monitoring multiple laser characteristics is possible but not always practical, and certainly not effective in a manufacturing environment.
Most current techniques require the beam to be optically sampled; anything placed in the beam will cause some amount of distortion to the sampled beam as well to the working beam. Focused multikilowatt fiber lasers achieve power densities of many megawatts per square centimeter. Thermal lensing of the sampling optics and the potential for damage of transmissive optics push traditional beam-sampling techniques to their limit and expose the diagnostic system to ultimate failure.
Noncontact beam measurement
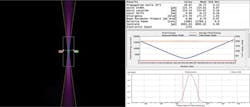
We have developed a Rayleigh-scatter-based profiler that provides instantaneous measurements of spot size, focal-spot location, focal-plane shift in the propagation and lateral axes, and m2 and BPP measurements. This beam profiler, BeamWatch, can assess lasers that have power densities of 2 MW/cm2 or greater without requiring any optics or waveguides to be placed in the beam path. Because no optic interacts with the beam, there is no practical limit to observable power densities.
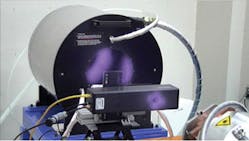
The profiler uses a CCD camera to image the laser path over a distance of more than 25 mm as it propagates through focus. The camera frame rate permits the focal plane, and thus any focal-plane shift, to be continuously monitored in ≤40 ms intervals.Recently, this Rayleigh-scatter-based fiber-laser measurement device and Ophir's 100 kW calorimeter-based laser-power sensor were used to monitor the output of IPG Photonics' 100 kW laser (see Fig. 3).
Kevin Kirkham is regional sales manager at Ophir-Spiricon LLC (North Logan, UT); email: [email protected]; www.ophiropt.com.


