Optical interference filters and coatings have advanced considerably in recent years. Thin-film coating manufacturers are continually developing new design and coating techniques that allow for optical filter performance levels that were previously impossible.
High-performance optical filters are now designed with impressive transmission and attenuation levels, exceptionally steep edges, and sub-nanometer bandwidths. Once the optical filter has been coated, it is up to the thin-film manufacturer to demonstrate that actual filter performance lives up to the theory trace.
Most manufacturers obtain optical filter transmittance measurements using a double-monochromator-based spectrophotometer or other grating-based measurement system. Unfortunately, a variety of limitations intrinsic to these instruments prevent them from evaluating the true performance of many filters and coatings.
For this reason, tunable lasers, custom-built spectrophotometers, and other advanced methods are now being used to obtain more accurate measurements. However, many of these solutions can be cost prohibitive, sensitive to misalignment, or have a limited wavelength range.
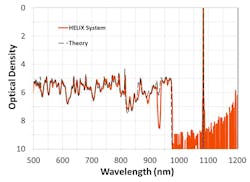
Figure 1: Transmission spectra of a high-performance ultra-narrowband filter measured with the HELIX System and compared to theory.
Fortunately, a new custom solution has been developed that is capable of measuring blocking to OD9 (-90 dB) (Figure 1), tracing edges to OD7 (-70 dB), and accurately resolving both sub-nanometer passbands and exceptionally steep edges.
Spectrophotometer Basics:
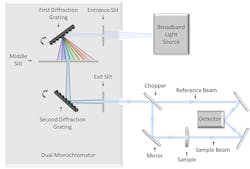
Double-monochromator-based spectrophotometers determine optical filter transmittance using a broadband light source and a series of diffraction gratings, slits, and mirrors. As broadband light strikes the diffraction gratings, it is dispersed into its component wavelengths, with each reflecting off each grating at a slightly different angle.
By rotating the gratings, each wavelength, or band of wavelengths, is able to be sequentially projected through an adjustable slit that is used to control the spectral bandwidth (SBW). Once the beam exits the slit, it is directed to the sample before reaching the detector (Figure 2).
Figure 2: Simplified diagram of a dual-monochomator-based spectrophotometer.
The result is a spectral dataset that gives measured transmittance over a range of wavelengths.
Spectrophotometer Limitations:
There are three main limitations of spectrophotometers that prevent them from obtaining accurate measurements of high-performance optical filters:
- There is a trade-off between light intensity and spectral resolution
- The beam is not collimated
- The spot size is relatively large
Achieving high spectral resolution is essential when measuring optical filters with sub-nanometer bandwidths and filters that transition from high transmission to deep blocking over a very short wavelength range. If the spectral resolution is not fine enough, measurements of these filters will show smeared and rounded edges or an unresolved passband with a rounded peak and low transmission.
Spot size is also an important consideration when measuring thin-film filters because the spatial uniformity gradient of the coating results in a slight shift of the filter edges and bands depending on the location of the incident beam. A relatively large spot size will yield a measurement with edge smearing because an averaging effect will occur over all filter locations that fall into the beam.
Likewise, the f-number of the incident beam is important because the spectral response of optical filters is angle dependent. At increasing angles of incidence (AOI), optical filter spectra shift down in wavelength at a rate that is determined by the effective refractive index of the filter. Since light from the incident beam strikes the filter at all angles in the range of the cone, this too will cause an averaging effect that ultimately results in edge smearing.
It is possible to achieve a relatively fine spectral resolution using a standard spectrophotometer by narrowing the slit to reduce the spectral bandwidth (SBW) of the beam. And edge smearing can be further reduced by introducing one or more small apertures to reduce both the spot size and cone angle of the incident light.
However, narrowing the slit and introducing apertures also reduces the light intensity, which raises the noise floor of the measurement by several orders of magnitude. Therefore, these techniques can be used to resolve marginally steep edges, but only to a level of OD2 (-20 dB) or OD3 (-30 dB). Conversely, a standard measurement with a moderate SBW and a wide aperture will yield a noise floor of approximately OD4 (-40 dB) or OD5 (-50 dB), but will show a larger degree of edge smearing.
Another requirement seen in many high-performance filters is out-of-band blocking that is directly adjacent to the passband or edge and specified to a level of OD6 (-60 dB) or beyond. In order to evaluate this requirement, many manufacturers necessarily have to extrapolate the wavelength where the edge would meet the required blocking level. But, extrapolating only gives a rough estimate and not the exact location of the edge point.
To evaluate out-of-band blocking, the noise floor can be lowered to OD6 (-60 dB) or OD7 (-70 dB) by widening the slit, removing any apertures, and attenuating the reference beam. Doing this will increase the light intensity, but the spectral resolution of the measurement will be coarse, resulting in dramatically smeared edges and distorted passbands. Therefore, this technique can only be used to measure out-of-band blocking that is not directly adjacent to the passband.
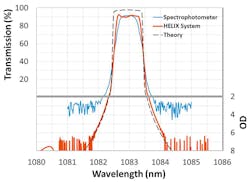
Figure 3: Measurement comparison of a 1083 nm high-performance narrowband optical filter. Data from the HELIX System shows a completely resolved square passband and edges measured to OD7 (-70 dB).
Advanced and Custom Options
Because of the limitations involved with spectrophotometers, coating manufacturers have turned to using tunable lasers and custom-built double and triple monochromators. But each of these solutions presents its own set of challenges.
Because of their high power output, collimated beam, and well-defined wavelength, tunable lasers are able to produce accurate, high OD measurements with very fine spectral resolution. Unfortunately, since the wavelength range of most tunable lasers is relatively narrow, multiple lasers would need to be used to measure the full transmission and blocking ranges of a single filter. And because tunable lasers are expensive to purchase and maintain, they are not ideal for use in high-volume manufacturing scenarios.
Custom systems consisting of multiple monochromators have the potential to lower the noise floor to OD8 (-80 dB) for a double monochromator, or OD12 (-120 dB) for a triple monochromator. However, these systems can be sensitive to misalignment, background light, and other environmental conditions unless they are fully contained in a custom-built enclosure.
The HELIX Spectral Analysis System
A novel custom solution has been specifically developed to overcome the challenges associated with measuring high-performance optical filters. The HELIX Spectral Analysis System minimizes the trade-off between light intensity and spectral resolution, and eliminates any edge smearing caused by cone angle or large spot size.
The HELIX System consists of a high-powered laser source used in conjunction with a double-monochromator. Therefore, the sample and reference beams are collimated, and spot size is smaller than that of standard spectrophotometers. The intensity of the source also allows the instrument to achieve high spectral resolution without raising the noise floor.
This custom configuration allows the system to measure optical filter blocking to a level of OD9, trace edges to OD7, and accurately resolve both sub-nanometer passbands and exceptionally steep edges. To learn more about the HELIX System, please click here to read a recent white paper that outlines its capabilities.


