CLAUDIA BRUECKNER
It’s easy to imagine how terahertz imaging could be extremely helpful in industry. But data-acquisition times must be reduced before ultrashort-pulse imaging systems can be used in industrial environments. This goal can be achieved through time-domain analysis of the pulse maximum and imaging of large fields—and for this, optical-design considerations are key.1
While standard optical-design software has been considered ineffective for designing and evaluating terahertz systems, our group at the Fraunhofer Institute for Applied Optics and Precision Engineering IOF and the Friedrich-Schiller-University Institute of Applied Physics, has successfully designed and optimized a terahertz time-domain system using the off-the-shelf optics design program ZEMAX (ZEMAX Development; Bellevue, WA).
Typically, the spectrum of pulsed terahertz radiation ranges from 0.1 to 2 THz (150-3000 µm wavelengths). It is possible to estimate the temporal imaging performance using the center-of-gravity frequency, which in this case was 0.4557 THz. (The center-of-gravity frequency is calculated by dividing the spectrum into increments and weighting each increment by the electric-field amplitude at that frequency.) The influence of diffraction varies over the wavelength spectrum of the pulsed terahertz radiation; for long wavelengths, diffraction dominates beam propagation. This variation determines the diameter of the optics for free-space propagation, which must be at least 10 times greater than the wavelength.
Aberrations scale with the dimensions of an optical system. The smaller the wavelength, the higher is the influence of geometric-optical aberrations—and the optical system must be corrected for diffraction-limited imaging. Only for the object point in the focus of an ellipsoidal mirror is the image an ideal point image. If lenses are used, the optical system must be optimized even for the on-axis point. The use of line and area detectors places even greater demands on the optical design. With these geometries, off-axis field points, which are influenced by field-dependent aberrations such as coma and astigmatism, also must be considered.
The system design
The optical components of our terahertz system measure 76 mm in diameter. For the peak frequency (0.4 THz) the aperture is about 100 times larger than the wavelength, enabling the use of ray-tracing for efficient optical design.
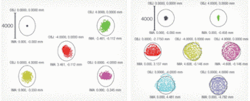
For diffraction-limited optics, the circle of confusion of the geometric-optical aberrations is smaller than the Airy disk. For this reason, and also because the refractive index of the dielectrics is frequency independent, terahertz systems do not require color correction. However, only a few materials are suitable for lenses. In our system, the lenses are made of Zeonex E48R (by Zeon; Louisville, KY), a high-performance plastic that is already widely used in the visible spectral range.2 The refractive index of Zeonex E48R is 1.515 ± 0.01 in the terahertz range, and the power absorption coefficient is 0.4044 cm-1 at 1 THz.A compact femtosecond fiber laser at 1060 nm generates the terahertz pulses.3 The terahertz beam has a Gaussian profile, which allows use of the ZEMAX Gaussian Beam analysis tools. The optical system is combined with an eight-channel electro-optic detector for terahertz imaging;4 the system includes illumination optics for focusing the terahertz radiation onto the sample, and imaging optics for imaging the object onto the line detector (Fig. 1). The paraxial magnification of the illumination path is –0.87. The basis of the illumination optics is a Gaussian beam telescope with frequency-independent magnification. The usual requirement that the distance between the single elements equals the sum of their focal lengths does not apply in this compact system setup. We used a lens instead of a mirror for focusing, increasing the sample space by a distance equal to half the lens diameter.
For ease of manufacturing, the imaging path is the reversed illumination path. The imaging path has a paraxial magnification of –1.149 (see Fig. 2). We modeled the ray density of the Gaussian beam at 750 µm using a Gaussian apodization of 2 and a numerical aperture of 0.3. The illumination path is diffraction limited for wavelengths down to 750 µm and field points up to ±4 mm in both the x and y directions. The imaging path is also diffraction limited down to 838 µm and field points up to ±4 mm in x and y directions.
Use of off-axis parabolic mirrors (OAPMs) avoids Fresnel losses and absorption from the bulk material of the lenses. The OAPM surfaces were processed by ultraprecision turning, which produced a surface roughness low enough that an optical pilot beam can be used for the alignment of the terahertz system.
The refractive index of the lenses at the laser-alignment wavelength (1060 nm) is 1.5213, which is similar to the refractive index in the terahertz range. The lenses have two aspherical surfaces with higher-order aspherical coefficients. As with the OAPMs, the refractive index and surface roughness of the lenses allow the use of an optical pilot beam. The aspherical shape enables the correction of spherical aberration and reduction of the lens thickness. But the inherent astigmatism caused by the off-axis parabolic mirror cannot be corrected.5 The center thickness of the lenses, 17 mm, is less than might be expected, to reduce absorption of the bulk material.Evaluation of the system
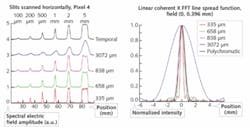
We evaluated the system using a slit target with different widths, and line targets of varying spatial frequencies. The resolution test targets were placed in the object plane. The results of a horizontal scan of the slit target confirmed that the slits were aligned in the x direction (see Fig. 3 top). It enabled a time-domain analysis of the pulse maximum of pixel 4 and a spectral analysis at the wavelengths 335, 658, and 3072 µm.
In addition, the following correlation between temporal and spectral line-spread function (LSF) could be observed: the full-width at half-maximum (FWHM) of the peak intensity of the temporal LSF agrees with the FWHM of the spectral LSF at the center-of-gravity wavelength (658 µm). At the bottom of the distribution, the temporal LSF gets much broader than at the center-of-gravity wavelength. Secondary maxima, which are present at the spectral LSFs, are smoothed in the time domain. The typical overshoot of the coherent edge-spread function (ESF), which can be observed spectrally, is also smoothed in the temporal analysis.The ZEMAX polychromatic coherent LSFs and ESFs can model temporal LSFs and ESFs, respectively (see Fig. 3, bottom). For this, the spectrum of the terahertz pulse must be sampled at 24 wavelengths (the maximum number in ZEMAX). The polychromatic LSFs and ESFs are averaged over all weighted wavelengths.
The polychromatic LSF shows the same behavior as the temporal LSF in the measurement: at 50% intensity level, the polychromatic LSF has nearly the same width as the distribution of the center-of-gravity wavelength. Thanks to the long wavelengths, the polychromatic LSF is smoothed at the bottom and runs much broader than at the center-of-gravity wavelength.
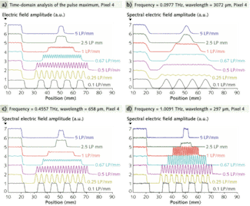
To examine the image of the line gratings for pixel 4, we aligned the lines in the x direction. We generated a time-domain analysis of the pulse maximum (see Fig. 4a) and spectral analyses at the wavelengths 297 µm, 658 µm, and 3072 µm (see Fig. 4b-d).
The temporal analysis of the pulse maximum produces a resolution limit of 1 line-pair/mm (LP/mm) with an intensity modulation of 0.22. At the center-of-gravity wavelength, the resolution limit is only 0.67 LP/mm—with an intensity modulation of 0.34. Thus, resolution in the time-domain analysis of the pulse maximum is higher than at the center-of-gravity wavelength, which is due to the shorter wavelengths in the spectrum. At 297 µm, a spatial frequency of 1 LP/mm can still be resolved with a modulation of 1. This requirement places significant demand on the optical design of an imaging system with pulsed terahertz radiation: imaging performance should be diffraction-limited down to the shortest wavelength of the spectrum.
The theoretical resolution limit can be determined in ZEMAX with the Modulation Transfer Function (MTF) feature. The chosen alignment of the lines of the gratings corresponds to the tangential direction (T). At pixel 4, the ideal and real MTF curves coincide from 658 through 3072 µm; thus, the system is diffraction limited at these wavelengths.
For 297 µm, the curve for the tangential MTF shows a slight deviation from the ideal curve; the system is nearly diffraction limited at this wavelength. This leads to a concurrence of the ideal and real polychromatic MTF curves.
The polychromatic MTF curves show the same behavior as the time-domain analysis of the image of the line gratings: the polychromatic MTF curves do not coincide with a certain spectral MTF curve. The influence of the short wavelengths creates a tail in the polychromatic MTF curves, where the resolution is higher than at the center-of-gravity wavelength. In the polychromatic MTF, no frequency limit for a real system can be determined, although a qualitative determination can be made of whether the real system can achieve diffraction-limited performance down to the short-wavelength end of the terahertz spectrum and thus maximum resolution on time-domain analysis of the pulse maximum.
REFERENCES
- C. Brückner et al., Appl. Optics 47, p. 4994 (2008).
- Zeon Corporation, Zeonex Product Brochure, www.zeonchemicals.com/zeonex.aspx.
- G. Matthäus et al., Opt. Commun. 261, p. 114 (2006).
- B. Pradarutti et al., Opt. Express 15, p. 17652 (2007).
- C. Brückner et al., Opt. Int. J. Light Electron. Opt. doi:10.1016/j.ijleo.2008.05.024 (2008).
Claudia Brueckner is a Ph.D. student at the Fraunhofer Institute for Applied Optics and Precision Engineering IOF, Optical Systems Department, Albert-Einstein-Strasse 7 07745 Jena, Germany; e-mail: [email protected].


