Optical Microscopy: An enhanced digital time-lapse technology for higher throughput bioanalytical research
CHIARA CANALI, ERIK SPILLUM, MARTIN VALVIK, NIELS AGERSNAP, and TOM OLESEN
A more complete understanding of cell dynamics—including cell growth, cell-to-cell interaction, and response to exogenous compounds—is enabling advances in diagnostics, drug discovery, and screening. Corresponding development of highly specialized imaging technologies has increased the range of research tools from the simplest brightfield light microscopes to highly advanced imaging instruments.1 However, expertise is still required in the optimization of image acquisition conditions for various microscopy platforms to observe dynamic changes in real time while still providing high signal-to-noise ratio.2 Meanwhile, demand grows for high throughput, and robust image analysis and data interpretation.3
Evolution of approaches
Brightfield microscopy, the simplest microscopy technique, involves the transmission of white light through a sample. The specimen absorbs part of the transmitted light and, hence, appears dark compared to the background.4,5 As brightfield microscopy offers a relatively small field of view (FoV) and thereby limits the volume to be analyzed, it introduces poor counting statistics. Furthermore, in conventional brightfield microscopy, it is difficult to visualize so-called phase objects that, as light propagates through the specimen, generate phase shift to make them appear transparent. This is often the case with mammalian cells.
To overcome such challenges, phase-contrast microscopy converts phase shifts to brightness changes in the image,6 while confocal microscopy7 provides increased optical resolution. Such techniques are, however, expensive, require a long acquisition time, and improper settings can cause significant imaging artefacts.
A new sensitive approach uses brightfield portable technology for digital8 time-lapse9 scanning through a miniaturized sample. The technology is well suited for liquid samples such as bacterial cultures and clinical isolates (e.g., urine10) and also for solid cultures of a single bacterial colony growing on an agarose support.
Image acquisition
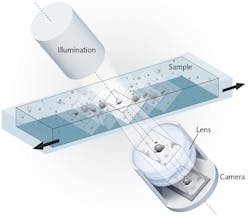
The method relies on an imaging system consisting of a digital camera, an illumination unit, and a lens, with the optical axis tilted 6.25° relative to the horizontal plane of the stage (see Fig. 1). The method creates an image stack by recording sequentially along the scan direction-which allows extraction of phase information. The image stack contains the sharpest image as well as adjacent images that are less in focus along the vertical axis. The stack is a parallelepiped covering the specimen's detection volume (Vdetection). Hence, Vdetection = L · H · W · sin(6.25) · n, where L and H are the camera chip dimensions divided by the magnification factor, W is the scan length, and n is the refractive index of the sample medium. Along the horizontal plane, all objects of interest are caught in focus.
Along the scan direction, the total number of longitudinal steps for image acquisition (N) can be chosen (minimum step length is 7.5 μm). Therefore, if an image stack consisting of two images separated by six steps is used, the perpendicular displacement between the object planes of the images (ΔZplane) in air is ΔZplane = sin(6.25) · 6 · 7.5 μm = 4.9 μm, and the detected volume is Vdetection = 4.9 μm · (N–1) · L· n (with L = 1.4 mm, H = 1.0 mm, W = 7.5 mm, and n = 1.34 for a water-like medium).10
The system provides 1.3 μm optical resolution, owing to a 5 Mpixel complementary metal oxide semiconductor (CMOS) camera chip (5.6 mm length and 4.0 mm height) with a focus depth of ~ 10 μm and optical magnification factor of 4, combined with the FluidScope proprietary lens system (Philips BioCell A/S; Allerød, Denmark). The digital images can be visualized on a monitor and recorded using a dedicated software (UniExplorer, Philips BioCell A/S). The FluidScope lens system is integrated in the oCelloScope microscope system, which enables placement inside a standard laboratory incubator (see Fig. 2). The technology supports various samples and containers from microscope slides to any microtiter plate up to 96 wells, and scans the latter in 2 min, 36 s.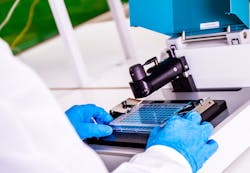
Data processing
While recording images over time, image processing and analysis algorithms can 1. estimate the cell covered area in each image of the stack, and 2. calculate a number of parameters (e.g., covered surface area, cells' eccentricity, symmetry, and intensity) that can be used to characterize the sample. Each algorithm is designed to provide specific advantages depending on analysis type and sample properties such as concentration and translucency. The algorithms are implemented in the UniExplorer software program, designed to simplify any adjustments to experimental settings and produce high-quality image data.
The output can be exported for further processing (for instance, to Microsoft Excel) and it is also possible to automatically generate time-lapse videos of the recorded images. The software communicates with the imaging system via Ethernet, which facilitates analysis setup, cell monitoring, and data processing outside the laboratory (especially advantageous for microorganisms requiring a high level of biosafety).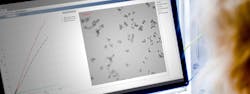
Implications
The technology supports a wide range of studies spanning microbiology,11 medicinal chemistry, and pharmaceutical biotechnology12—including monitoring of bacterial and fungal growth (see Fig. 3), exploration of growth kinetics and inhibition,13,14 and investigation of dynamic changes in cell morphology.15 It can also facilitate higher throughput monitoring of microorganism response to drugs and toxicants in bioanalytical research.11 In addition, compared to conventional optical density measurements, the technology allows capturing of important early stages in microbial growth by distinguishing among different growth patterns16 and detecting a statistically significant antibiotic effect on bacteria within six minutes.10 This can considerably reduce hands-on and incubation times, and thus may advance early targeted antibiotic therapy. Moreover, low bacterial concentrations can be visualized14 with the option of focusing specifically on the cell type of interest and excluding possible exogenous contaminants. Finally, this digital time-lapse optical technology may help enable future applications in basic cancer biology,17 personalized medicine, and stem cell research.
REFERENCES
1. S. M. Wilson, A. Bacic. Nat. Protoc., 7, 1716–1727 (2012).
2. M. M. Frigault, J. Lacoste, J. L. Swift, and C. M. Brown, J. Cell Sci., 122, 753–767 (2009).
3. P. M. A. Antony, C. Trefois, A. Stojanovic, A. S. Baumuratov, and K. Kozak, Cell Commun. Signal, 11, 24 (2013).
4. W. Qiang, F. A. Merchant, and K. R. Castleman, Microscope image processing, 1st Ed., Elsevier, Burlington, MA (2008).
5. D. Murphy, Fundamentals of light microscopy and electronic imaging, 1st Ed., John Wiley & Sons, Baltimore, MD (2001).
6. F. Zernike, Physica, 9, 974–986 (1942).
7. R. Price and G. W. Gray, Basic confocal microscopy, Springer (2011).
8. R. J. Walter and M. W. Berns, Proc. Nat. Acad. Sci., 78, 6927–6931 (1981).
9. D. L. Coutu and T. Schroeder, J. Cell Sci., 126, 3805–3815 (2013).
10. M. Fredborg et al., J. Clin. Microbiol., 51, 2047–2053 (2013).
11. M. Fredborg et al., Eur. J. Clin. Microbiol. Infect. Dis., 34, 2385–2394 (2015).
12. T. Kjeldsen, M. Sommer, and J. E. Olsen, BMC Microbiol., 15, 1–6 (2015).
13. S. D. Aunsbjerg, K. R. Andersen, and S. Knøchel., J. Microbiol. Methods, 119, 196–202 (2015).
14. L. E. Uggerhøj et al., ChemBioChem., 16, 242–253 (2015).
15. D. D. Khan et al., J. Antimicrob. Chemother., 70, 3051–3060 (2015).
16. M. Fredborg et al., BMC Microbiol., 15, 1–8 (2015).
17. N. Ashley, M. Jones, D. Ouaret, J. Wilding, and W. F. Bodmer, J. Pathol., 234, 34–45 (2014).
Chiara Canali, Ph.D., is application specialist, Erik Spillum is R&D engineer and project manager, Martin Valvik is algorithm system architect, and Niels Agersnap, Ph.D., is system architect, all with Philips BioCell A/S, Lillerød, Denmark, while Tom Olesen is CTO of the Philips HealthTech Incubator (Allerød, Denmark); e-mail: [email protected]; www.philips.com/a-w/biocell/home.html.