Proper application of lubricants to metal and other surfaces, as well as precise and continuous detection of small amounts of residual oil on metal parts, is important for quality assurance in downstream industrial processing. Unfortunately, currently used methods such as infrared (IR) or diffuse-reflectance spectroscopy are dependent on constant reflection properties of the surfaces being analyzed, and do not work for lubricant amounts of below 200 mg/m2 of surface area in inline applications. But time-integrated laser-induced fluorescence, or LIF(t), spectroscopy is particularly beneficial for this kind of surface analysis.
Wavelength- and time-dependent fluorescence
To detect typical lubricants applied in layers of nanometers up to the millimeter scale, Kienzle-Prozessanalytik (Flensburg, Germany) has developed its Visor instrumentation for inline qualitative and quantitative analysis of functional coatings (Lubrivisor) as well as the trace analysis of residues of process media (Kontavisor). The Visor instruments make inline measurements with 10 ms sampling time and a traversing speed of up to 1 m/s—much faster than IR or radiometric scanning techniques.
The basic principle of LIF spectroscopy is the absorption of excitation laser radiation by molecules followed by re-emission of fluorescence illumination on the nanosecond scale. Statistical registration of photons using a photomultiplier tube detects very low quantities of a material with high sensitivity. For example, Visor can detect residues of manufacturing oils below 1 mg/m2 and special coatings like palm oil applied in nanometer-thick layers.
Ultraviolet (UV) laser excitation causes not only the fluorophores of the target molecule, but also molecules of the surrounding matrix—mainly from organic matter—to fluoresce. Registering only the spectral intensity distribution of the fluorescence does not separate the spectra of individual substances. Therefore, a time-integrated LIF(t) approach observes the decay times of the fluorescence signals in a suitably chosen wavelength range.
After each laser excitation, the time decay of the fluorescence radiation is registered in two appropriately positioned windows, measuring time-integrated intensity as values I1 and I2 (intensity value based on the number of photons counted in the first gate and second gate, respectively). The value for I2 and even the differential value (I2/I1) depend on material concentration and layer thickness; unwanted background signals are removed in the first time window. In a third time window that is positioned about 1 μs after the second one, the ambient light intensity I3 is registered and automatically subtracted from the values I1 and I2.
In the Visor instrumentation, optical excitation is performed by a passively Q-switched UV microchip laser from Teem Photonics (Meylan, France) with a repetition frequency of 11 kHz. Single laser pulses with pulse duration of typically 0.5 ns and an emission wavelength in the UV (355 nm) or deep-UV (266 nm) are delivered by a quartz fiber bundle of up to 20 m in length; the probe head has a typical average optical output power of 250 μW. A second quartz fiber bundle delivers the fluorescence signals to a Hamamatsu photomultiplier module.
Since each single fluorescence measurement takes place on a nanosecond time scale, the results of surface measurements on moving parts or sheets do not depend on process speeds, which can reach more than 2000 m/min. Depending on the application, a special system calibration is performed with samples manually prepared or directly taken from the process. Corresponding surface amounts are mostly determined by a gravimetric measurement, but also with other suitable laboratory reference methods. Therefore, achievable accuracy depends on the precision of the reference.
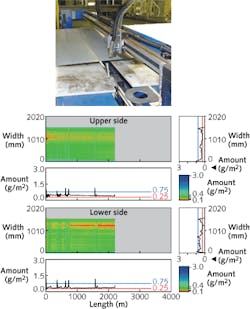
A standard application is the lubrication control of different kinds of prelubes/oils on steel or aluminum coil material in the low g/m2 range for the automotive or food packing industry (see figure).

