RAJIV BHATIA AND ADRIANA CIANI
Optical design of lenses and lens systems are being driven by the increasing size of sensors and shrinking size of pixels. Chip sizes as large as 36.7 × 49.0 mm (39 megapixels, each 6.8 µm in size) are now available for use with large-format cameras, while mobile-phone cameras have chips of up to 5 megapixels. These parameters pose new challenges in design and testing.
A new approach to hardware and software development is required to test these lenses. The ideal instrument would be one that can easily be used in the production line for a Go/NoGo analysis and can be used as a diagnostic instrument as well-using the same measurement data.
Interferometers and modulation-transfer-function (MTF) measurement systems are the traditional instruments used for testing lenses. Interferometers are good for obtaining detailed results, but are relatively expensive and difficult to integrate into the production environment. More important, they cannot be used for off-axis testing and generally work at only one wavelength, thus ruling out the measurement of chromatic aberrations. While MTF measurement systems can be used for off-axis testing, the information available from such systems is limited largely to Go/NoGo. Moreover, they are scanning systems that use moving parts to find the best focus, and maintenance becomes an issue.
The ideal instrument would give detailed information as does an interferometer (Zernike coefficients, spot diagrams, point-spread function, and MTF), be robust (insensitive to vibrations and air currents), make on-axis as well as off-axis measurements, and be easily reconfigurable for different lens systems. It would also be able to measure chromatic aberrations, have full flexibility in the lab for testing different optical elements, have no moving parts for systems for use in the production line, be compact and fast, and be able to help in the on-line adjustment and optimization of the lens system. SpotOptics has developed such systems based on the Shack-Hartmann method (see Fig. 1).
Calibration with the Shack-Hartmann method
In the Shack-Hartmann method the pupil from the test element is imaged onto a lenslet array (typical pitch of 150 to 300 µm, focal lengths from 4 to 50 mm).1 It decomposes the pupil into spots, whose positions depend on the aberrations in the wavefront. The positions of these spots are recorded by a CCD or CMOS camera and are used to compute the wavefront as well as other parameters (Zernike coefficients, spot diagram, and so on).
The main advantages of an instrument based on this method are its compactness and robustness (relatively insensitive to vibrations and air currents), which allow the sensor to be put into the production line, with the possibility of analysis in a closed-loop for adjustment, such as alignment, right on the assembly machine.
The major limitation of this method is that the test beam should fit on a typical camera chip (less than 10 mm), either by using a beam compressor for larger beams or beam expander for smaller beams. Thus, precalibrated wavefront sensors have limited use, as they maintain their accuracy only for a relatively small range of beam sizes between 4 and 8 mm and wavelength ranges. Unless the additional optical elements used are of a very high quality, which severely limits the utility of the wavefront sensor, the challenge is to obtain high accuracy by removing their aberrations through proper calibration.
Spots from the calibration and test images must be automatically combined to remove these aberrations. While it is relatively easy to develop an algorithm for small aberrations, such as small spot displacement, it is surprisingly difficult to develop a robust algorithm for real-world situations, such as aberrations that cause large spot displacement and missing spots due to defects on the optical elements. Many people have tried to circumvent this problem by using lenslets with very short focal lengths of about 4 mm, but that option compromises the accuracy of the measurements.
Based on our experience, we have been able to develop a very robust algorithm to overcome this problem. The algorithm opens up vast possibilities in testing by permitting the use of off-the-shelf optical elements and brings to the Shack-Hartmann method a very important capability: versatility. Some off-axis testing applications would not have been possible without this new development.
Off-axis testing
Among the most difficult things to define and measure for complex optical systems are best focus and optical axis. Only with the help of off-axis measurements over the full field is it possible to define the configuration that gives best images over the whole field. For example, it is generally accepted that coma due to tilt can be compensated by decentering the element, but this approach does not always produce desirable results for off-axis images.5
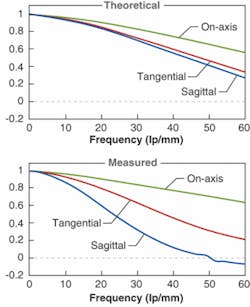
We used our instrument to test a complex f/4 digital zoom camera lens with more than 20 optical surfaces in parallel light at wide-angle position, and compared the measurements with the theoretical predictions (see Fig. 2). Though many parameters are available from the software, we focus here only on two: MTF and the Zernike coefficients.The theoretical MTF values for a frequency of 60 lp/mm are 0.56 on-axis, 0.34 tangential, and 0.27 sagittal. The corresponding measured values are 0.64, 0.21 and -0.073, respectively. This shows that the lens has a much larger off-axis defocus and other aberrations compared to that predicted by the model. However, from MTF measurements alone it is not possible to infer what is causing this drop: one needs the full Zernike analysis.
One interesting point to note is that in the center the measured on-axis MTF exceeds that predicted by the model, indicating that the quality in the center exceeds the specs. This is confirmed by the lower value of the measured spherical aberration, as discussed below.
The measurements above refer to a wavelength of 650 nm. They can be made at any other wavelength by using a filter. Recalibrating the instrument is easy for any wavelength, because of the efficacy of the combine algorithm.
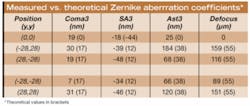
We compared the standard Zernike aberration coefficients (third-order coma, spherical aberration, and astigmatism) measured at five positions with the theoretical values from the model (see table). We also calculated the defocus shift in microns, from flat image plane to best focus. It is worth noting that the defocus shift computed by our software mathematically accounts for all the aberrations; no physical scanning is involved, unlike MTF measurement systems.The design value of on-axis spherical aberration is -44 nm, while the measured value is -18 nm; thus, the actual lens performance exceeds the design value (as already noted for the MTF). However, at other off-axis angles, it is much more. This information can be useful for analyzing whether the problem is in production, such as incorrect shape of an aspherical lens, or in the mounting, such as incorrect spacing of the elements.
The nonzero value of coma in the center indicates the presence of misalignment of the optical elements, while that of astigmatism is due to a combination of misalignment and stress. Moreover, both coma and astigmatism are nonsymmetrically distributed with respect to the optical axis. For such a complex lens, this indicates that apart from the contribution of off-axis aberrations, misalignment of the individual lenses and groups of lenses are making a significant contribution to the aberration field.
This discussion underscores the need to optimize lens performance over the whole image field, which was not possible until now because of the lack of measuring instruments. Feedback from such a full-field analysis can be a powerful and indispensable tool for analyzing problems both in production and in mounting, leading to considerable savings in time and money. While we focused here on a digital camera lens, we have used such systems for testing mobile-phone camera lenses, telecentric lenses at 308 nm, and TV lenses.
REFERENCES
1. R.K. Bhatia, A. Ciani, P. Rafanelli, Proc. SPIE 1994, 68 (1993).
2. R.K. Bhatia, A. Ciani, Proc. SPIE 3134, 167 (1997)(also in: Selected SPIE Papers on CD-ROMVol. 3 and Optical Testing, Ed.: Daniel Malacara-Hernandez, Vol. CDP03 (1999).
3. R.B. Shack and B.C. Platt, JOSA 61, 656 (1971).
4. R. Wilson, F. Franza, L. Noethe, J. of Modern Optics 34, 485 (1987).
5. R.K. Bhatia, Proc. SPIE 2479, 354 (1995).
Rajiv Bhatia and Adriana Ciani, both ex-astronomers, are the founders of SpotOptics, via Turazza 48, 35128 Padova, Italy; e-mail: [email protected]


