While remote sensing has long been a useful mapping or surveillance tool for governments and the military, as well as for a plethora of other users such as the energy industry, meteorologists, and scientific researchers studying changes in the world’s climate, geospatial imagery is now a hot technology that is suddenly appearing everywhere. Anyone with access to the Internet can use it—think Google Maps—and even real estate and insurance industries are becoming prolific users of satellite imagery.
Earth-observing satellites have been around since the early 1970s and imaging technology has evolved in many ways. These imaging technologies include NASA’s classic MODIS and ASTER imaging instrumentation, commercial satellites capable of 0.5 m resolution, agile satellites that can point faster and collect wider swaths of data, and software capable of linking satellites together for enhanced data collection during crisis situations.
Among its many benefits, satellite imagery plays a huge role whenever natural disasters strike. As wildfires raged through Southern California last October, for example, such imagery helped firefighters battle the blazes by providing detailed maps of where the fires were and how hot they were, which areas contained vegetation or structures that were likely to burn, and which areas had already burned. And thanks to the Internet, homeowners could check on the Web to see if the fire was contained enough to return home—or if there was anything left to go home to.
Numerous satellites and other assets were used to collect data on the California wildfires, according to NASA. The remote sensing systems used encompassed everything from unmanned aerial vehicles (UAVs), light detection and ranging (lidar), and thermal imaging, to Earth-observing spectrophotometric instrumentation.
Unmanned aerial vehicles
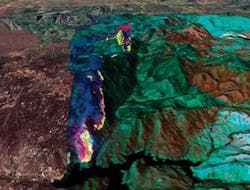
During the wildfires, NASA and the firefighting team relied heavily on a high-tech UAV research plane, Ikhana, which is equipped with thermal infrared (IR) sensors that can “see” through smoke to capture shots of hot spots (see Fig. 1). Images downlinked from Ikhana were superimposed over Google Earth maps of the fire area to provide almost instant feedback on the intensity of the fires. The near-instant downlinking capability of the UAV was critical, because satellite data takes a while to get to the ground and processed-typically a minimum of one to two days.
Satellite imaging
A closer look at MODIS and ASTER provides a little technical perspective on some of NASA’s classic Earth-observing imaging instruments. Both instruments are flying on NASA’s Terra satellite, launched in late 1999. A second MODIS instrument launched aboard the Aqua spacecraft in 2002.
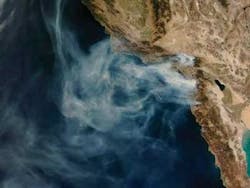
MODIS is an atmospheric, land, and ocean imaging instrument. Many of the images seen on TV or the Web during the California wildfires were shot by MODIS (see Fig. 2). According to NASA, the instrument provides high radiometric sensitivity (12 bit) in 36 spectral bands ranging in wavelength from 0.4 to 14.4 µm. Two bands are imaged at a nominal resolution of 250 m at nadir, with five bands at 500 m, and the remaining 29 bands at 1 km. And a ±55° scanning pattern at the Earth-observing-system (EOS) orbit of 705 km achieves a 2330 km swath to provide global coverage every one to two days.The scan-mirror assembly of MODIS relies on a continuously rotating, double-sided scan mirror to scan ±55°, which is driven by a motor encoder built to operate at 100% duty cycle throughout the six-year instrument design life (which MODIS on Terra has already exceeded). The optical system consists of a two-mirror off-axis afocal telescope to direct energy to four refractive objective assemblies: one each for the VIS (visible), SWIR/MWIR (short- and mid-wave IR), and LWIR (long-wave IR) spectral regions to cover a range of 0.4 to 14.4 µm.
A high-performance passive radiation cooler provides cooling to 83 K for the 20 IR spectral bands on two mercury cadmium telluride (HgCdTe) focal-plane assemblies (FPAs). And a photodiode-silicon readout technology for the visible and near-IR provides quantum efficiency and low-noise readout with exceptional dynamic range, says NASA.
The broad spectral coverage and high spectral resolution of ASTER’s images provide scientists in numerous disciplines with critical information for surface mapping and monitoring dynamic conditions and temporal changes.
ASTER consists of three separate instrument subsystems operating at visible and near-IR (VNIR) wavelengths, as well as SWIR and thermal IR (TIR). The VNIR system operates in three spectral bands with a resolution of 15 m, according to NASA. The SWIR subsystem operates in six near-IR spectral bands through a single, nadir-pointing telescope that provides 30 m resolution. And the TIR subsystem operates in five bands using a single, fixed-position, nadir-looking telescope with a resolution of 90 m.
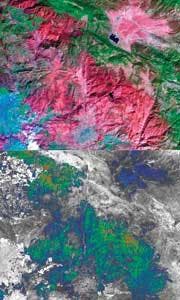
Some of most interesting images from the California wildfires were ones captured afterward by ASTER, illustrating the severity of the damage (see Fig. 3).Commercial satellite advances
Two leading U.S. commercial satellite companies, DigitalGlobe (Longmont, Colorado) and GeoEye (Dulles, Virginia), provided imagery during the wildfires, which is something most firms are willing to do during any natural disaster or emergency anywhere in the world.
As far as state-of-the-art Earth imagery from commercial satellites goes, DigitalGlobe launched WorldView-1 in October 2007, which boasts 0.5-m-resolution panchromatic sensors. “Currently, none of our customers outside of the U.S. government can receive imagery better than 0.5 m resolution. It’s a limit specified by the government,” explains Chuck Herring, DigitalGlobe’s corporate communications director. “For the foreseeable future, it doesn’t look like 0.5 m resolution will be broken for commercial satellites.”
Nonetheless, there are several other technology advances taking place with commercial satellites. WorldView-1 is DigitalGlobe’s newest satellite and boasts four to five times more onboard memory than the previous generation satellite, QuickBird, launched in 2001. From satellite down to ground, WorldView-1 has eight times better capacity that can downlink at any given time. And it also collects about five times the amount of imagery (more than 750,000 km2) as QuickBird (150,000 km2) on a daily basis.
Another significant technology improvement is satellite agility. WorldView-1 uses gyroscopes to position or “point” the satellite to control its attitude or how it is pointing in reference to Earth. It points about ten times faster than QuickBird, so can collect more imagery faster.
Looking forward, GeoEye plans to launch GeoEye-1 next year, outfitted with 1.65 m multispectral hardware. DigitalGlobe is working on WorldView-2, which will be able to image in eight multispectral regions at 1.8 m.
Hyperspectral imaging and synthetic aperture radar (SAR) are both being considered for future commercial satellites, but user demand is currently focused on visible wavelengths.
Tying it all together
Another important piece of the imaging puzzle is software. NASA’s Earth science satellites are linked together by software—originally developed in 2003 by NASA’s Jet Propulsion Laboratory (JPL; Pasadena, CA)—to form a virtual web of sensors with the ability to closely monitor the globe far better than individual satellites. An imaging instrument on one satellite can detect a fire or other hazard and then automatically instruct another satellite with the ability to take more detailed images for a closer look.
“The general concept is that we’re tying together a number of sensors via processing so they run with as little human intervention as possible,” explains Steve Chien, JPL principal scientist in artificial intelligence. “MODIS can observe forest fires from space, but only at very low resolution. Each pixel is between 100 m to 1 km, depending on which wavelength you’re using. But we can automatically tie in those high-pixel ones with the other sensors. Other sensors being tied-in include UAVs, satellite sensors that are more like point-and-shoot sensors, and various ground sensors to study events such as volcanoes and flooding. When we get an alert triggered from a ground sensor or from one of the very-broad-coverage sensors, we start using more controllable assets, such as flying a UAV over the area, to acquire more information and close that loop as quickly as possible.”
One of JPL’s current research projects that may be called into use during future wildfires or other disaster-response situations is UAV-based SAR. The use of SAR data, Chien says, enables scientists to build software essentially capable of tracking forest fires as they progress. This capabity can be achieved by looking at the radar signature to determine what is forest and what is burned forest, and to estimate which areas are most likely to burn. Then, fuel burn maps can be computed from the SAR data. Looking at changes from subsequent overflights shows what is burned and the information can be combined with digital elevation maps and wind measurements and forecasts to automatically track fires as they progress.


