Translational Research/Flow Cytometry: Large-scale flow cytometry enables climate-change insight
JARRED E. SWALWELL
A major reason for the fact that various models predict different climate scenarios for Earth's next 50 years is our incomplete understanding of how carbon moves through the environment. A particularly relevant question involves the mechanisms of carbon uptake in the oceans: The answer promises to reveal how life will react to changes in temperature and carbon dioxide (CO2).
Understanding an ecosystem requires understanding of the organisms at the base of the food chain—the autotrophs that convert energy into biomass. In the open ocean, phytoplankton fills this role. Prochlorococcus, the smallest phytoplankton, is the dominant species. With a diameter of just 0.5 to 0.7 μm, its prevalence to depths of around 200 m makes it the most abundant photosynthetic organism on Earth.1 But getting a handle on its distribution and concentration is a daunting task, since the surface area of the world's oceans exceeds 300 million square kilometers.
What type of measurement can reliably estimate the population of a submicrometer-scale organism over such a large area? The answer is continuous sampling, which is why a researcher at the University of Washington designed SeaFlow—an instrument that features an innovative optical design to allow continuous monitoring of plankton. This is key to understanding not only global distribution of the organisms, but also their response to varying conditions globally and regionally.
Optical innovation for speed
Flow cytometry is a cell-counting and characterization technique. A typical flow cytometer channels cells from a liquid sample into a narrow stream through hydrodynamic focusing of an enveloping sheath fluid. A single-wavelength laser is focused on an interrogation region, and the cytometer collects scattered light, usually in both the forward- and side-scattered directions.
A flow cytometer can also be equipped with several spectral channels to detect fluorescence. The narrow stream is necessary to ensure each cell within the sample is uniquely identified. Photomultiplier tubes measure scattered light and specific fluorescence emission spectral regions of individual cells at rates of several thousand per second. Light scatter is roughly proportional to cell size, and fluorescence reflects the emission spectra of pigments or stains.
Over the past 30 years, flow cytometry has become an integral tool for oceanography because of the speed and sensitivity with which these instruments measure the abundance, size, and fluorescence characteristics of individual plankton cells.2 We recognized that the technique could theoretically estimate overall plankton population density and also discriminate among various plankton types.
Current generations of automated flow cytometers, such as the CytoBuoy3 and FlowCytobot,4 have been used primarily on moorings in coastal regions, with a few examples of use onboard a ship while underway.5,6 But traditional flow cytometry guarantees the uniqueness of each measurement by allowing only one cell at a time into the sampling region, the region defined by the pressure of the sheath fluid on the sample fluid.
The instruments designed for oceanography applications require time-consuming sample preparation as well. When sampling large areas of the sea, time translates to distance between samples. So the standard approach won't meet the requirements of continuous sampling.
Optically defining sample volume
A defining feature of SeaFlow is an optical system we developed known as Virtual Core cytometry,7 which eliminates the need for sheath fluid—a common feature of all other flow cytometers. Instead, measurements are performed within a 200-μm-diameter stream of 100 μm pre-filtered seawater, which opens the way for continuous measurements.
Virtual Core cytometry utilizes three detectors to determine the position of particles within the stream. Two position detectors determine the side-to-side position of a particle, and the axial position (relative to the focal plane) of a particle is based on scaling these detectors with the forward light-scatter signal. The instrument analyzes a fraction of the 200-μm-wide stream—a detectable region defined as the cross-sectional area within the stream where particles are detected, and has a fixed volume set by the field of view of the optical system defined by the magnification of the objective and the width of the field stop.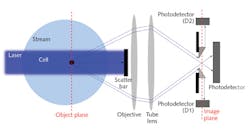
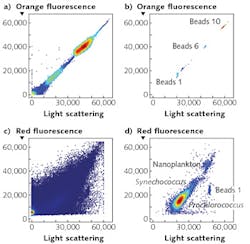
In addition, the signal from the forward-scatter detector cannot be lower than that from the position-sensitive detectors. Those constraints, combined with active stabilization of the laser output, limit the sample region to a consistently defined volume. Application of the OPP software filter creates flow cytometry bivariate dot plots indistinguishable from those obtained with conventional flow cytometers (see Fig. 2).
The scientific importance of SeaFlow, and its creative optical design, was recognized by Edmund Optics, which awarded $10,000 to assist development of a compact, low-power version of the instrument. After submitting our initial design in an educational grant proposal, Edmund product engineers pointed out some performance improvements and cost savings possible with alternative components. We've replaced several of our first-generation components with stock lenses, filters, and mirrors, along with a custom optical filter (see Fig. 3), and the company continues its collaboration as we prepare our latest design, called PipeCyte, for scheduled deployment later in 2017. The PipeCyte is smaller and more energy-efficient than SeaFlow, and the streamlined design should allow us to produce more instruments for simultaneous environmental monitoring on multiple platforms around the world.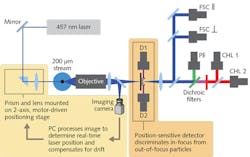
Field-proven performance
SeaFlow uses seven analysis parameters, including two position-sensitive detectors, forward scatter in orthogonal and perpendicular polarization states, chlorophyll, a second chlorophyll detector for large particles, and phycoerythrin. The instrument uses light scattering and autofluorescence properties of individual cells to discriminate and quantify different cell populations that span 0.5 to 15 μm.
In practice, a ship's seawater system supplies raw seawater to be analyzed. The water passes through a 100 μm stainless steel mesh filter prior to input to a 200 μm nozzle to form the measurement stream. SeaFlow collects information about the size and pigment content of an individual cell, and counts several-thousand cells every second in real time. The continuous flow features enable exploration of surface phytoplankton dynamics at a spatial scale ranging from a few meters to thousands of kilometers.
To determine cell concentrations of different populations, the volume of the OPP region (called the Virtual Core) is first calculated by multiplying the volume of the detectable region by the ratio of OPP particles to total detectable particles. The number of cells within a given population divided by the OPP volume is the concentration in cells/milliliter. Analysis of cultures and natural samples indicates that cell concentrations obtained with SeaFlow agree with those obtained with the BD Influx, a gold-standard cytometer.8
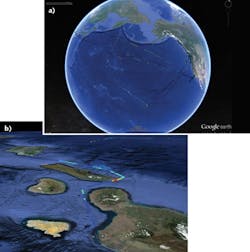
The Virtual Core optics, in combination with a number of automated features that simplify setup and operation of the instrument, have allowed us to install SeaFlow on several research vessels in 2010. We have collected more than 200 days of data, representing the equivalent of 100,000 flow cytometric samples. We have also operated SeaFlow on a cargo vessel that crosses the Pacific Ocean from Long Beach, CA, to Hong Kong, and collected another 50,000 km worth of data from these transects.
Combined with biogeochemical measurements of CO2 flux in the ocean, the SeaFlow data indicate that phytoplankton hotspots are responsible for disproportionate amounts of carbon cycling. The more-compact, lower-power version of the instrument will allow extension of the measurement platform to include autonomous underwater vehicles, ocean moorings, and research buoys. Ideally, this technology will investigate water quality in economically disadvantaged areas of the world, as well as the impact of industrialization on nearby waterways.
REFERENCES
1. F. Partensky, W. R. Hess, and D. Vaulot, Microbiol. Mol. Biol. Rev., 63, 1, 106–127 (1999).
2. M. Sieracki et al., "Sustained ocean observations and information for society," Proc. OceanObs '09, 2, ESA Publication WPP-306 (2009); doi:10.5270/oceanobs09.cwp.81.
3. G. B. J. Dubellar and P. L. Gerritzen, Sci. Mar., 64, 255–265 (2000).
4. R. J. Olson, A. Shalapyonok, and H. M. Sosik, Deep Sea Research Part I: Oceanographic Research Papers, 50, 2, 301–315 (2003).
5. A. Cunningham, D. McKee, S. Craig, G. Tarran, and C. Widdicombe, J. Marine Syst., 43, 1–2, 51–59 (2003).
6. M. Thyssen, N. Garcia, and M. Denis, Biogeosciences, 6L, 569–583 (2009).
7. J. E. Swalwell, T. W. Petersen, and G. van den Engh, Cytometry Part A, 75, 11, 960–965 (2009).
8. J. E. Swalwell, F. Ribalet, and E. V. Armbrust, Limnol. Oceanogr., 9, 466–477 (2011).
Jarred E. Swalwell is a research engineer in the Armbrust biological oceanography lab at the University of Washington, Seattle, WA; e-mail: [email protected]; http://armbrustlab.ocean.washington.edu.