SPECTROSCOPY: Cancer detection using Stokes shift spectroscopy
Stokes shift spectroscopy (S3)—a simple and effective method of acquiring fluorescence signals by a fixed wavelength shift interval (Δλi) between excitation and emission—has proven beneficial for multiple-fluorophore analysis in tissue.1 Although the technique is superior to conventional methods, this fact is not well known. Thus, while fluorescence spectroscopy has been widely investigated for cancer diagnosis, the application of S3 for cancer detection has been limited.2 The technique can also be applied to the detection of other diseases.
Let's look at the benefits S3 offers over other conventional spectroscopic techniques. We'll explore S3's efficiency in recognizing spectral fingerprints of fluorophores in complex mixtures, and its ability to highlight the difference between cancerous and normal tissues. We will also show how to select an optimal wavelength shift interval to obtain the best S3 spectra for the purpose of cancer detection.
Conventional vs. novel
The conventional spectral methods applied in tissue optics studies are absorption (O.D.), fluorescence (emission and excitation), and excitation-emission matrix (EEM) measurements.
In absorption measurements, only a few chromophores can match the detectable level in tissue.
Fluorescence spectroscopy—either emission or excitation—can detect low-level fluorophores, but because of the fixed pump (detecting) wavelength, the strongest emission (excitation) signal can be acquired only for one or two fluorophores. In addition, the emission signals of most fluorophores have very wide full width at half maximum (FWHM). So emission and excitation measurements provide limited resolution and information.
Although EEM can be used to ensure the coverage of all endogenous fluorophores, the acquisition is extremely time-consuming and thus not suitable for clinical application. Furthermore, redundant information in EEM conceals alteration of the spectral fingerprints of cancerous and benign breast tissues.
By contrast, S3 measurements provide greater resolution and more information than fluorescence, combining absorption and their spectral shifts. They can also be used to acquire sufficient information about multiple key fluorophores in a much lower concentration and relatively higher resolution by employing a single scan than can EEM. Thus, S3 can dramatically reduce data acquisition time and keep the classification accuracy reasonably high. Let's see how it works.
Measuring fluorophores
Tryptophan, collagen, NADH, and flavin are key molecules in cancer diagnosis using spectroscopy.3 For breast cancer, the most common grading system used in the U.S. is the Scarff-Bloom-Richardson (SBR) system, which is a staging system to determine how aggressive and invasive the cancer is.4 According to the features described by the SBR system, higher cell density is the hallmark of breast cancer; therefore, the increase of fluorescence from the main fluorophores inside cells—tryptophan, NADH, and flavin—should be expected. The primary fluorophore in the breast tissue extracellular matrix is collagen.5 For invasion and subsequent metastasis, tumor cells degrade the surrounding extracellular matrix (ECM), which is composed mainly by collagen. Understanding these changes during breast cancer evolution is critical to reveal the contributions of the fluorophores in tissues using spectroscopic techniques.
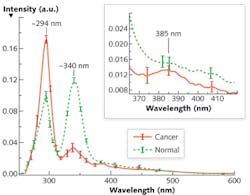
The alterations of Stokes shift spectra (S3) between cancerous and normal tissues are due to the changes of fluorophores such as tryptophan and collagen, and can be highlighted using an optimized wavelength shift interval. We recorded the average S3 spectra of 15 pairs of cancerous and normal breast tissues using a PerkinElmer LS 50 spectrometer (see Fig. 1). The results showed salient differences—two reverses of the peak intensities at ~ I294 and ~ I340, and a tiny peak at 385 nm for the cancerous tissue—that may reflect tissue fluorophores' change during the evolution of cancer.
Understanding which components mainly contribute to these changes necessitates S3 measurement of the main fluorophores-that is, tryptophan, collagen, NADH, and flavin (see Fig. 2a). Our work to acquire S3 profiles of breast tissues with Δλi = 40 nm demonstrated that the changes are mainly contributed from tryptophan, collagen, and NADH.
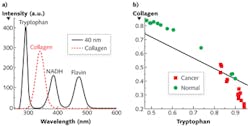
We applied the nonnegative least square (NNLS) analytical method to the S3 of both cancerous and normal breast tissues to study the relative content changes of fluorophores (see Fig. 2b). The results indicated that the relative contribution of collagen to the S3 signal in the normal tissue is higher that of the cancerous tissues, while the relative contribution of tryptophan in normal tissue is lower than that in the cancerous tissue.
We observed reproducible results in human prostate and lung cancer tissue studies, as well. In both cases, as with the breast tissue, two inverse spectral properties were observed in S3 measurements for cancerous and normal tissues.
Diagnostic significance
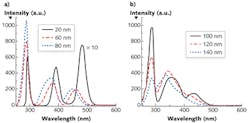
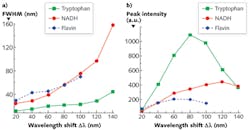
To explicitly understand the diagnostic significance of these two inverse properties, we measured the S3 of a mixed solution of tryptophan, NADH, and flavin with the concentration of ~0.4 mg/cm3 with various Δλi—from 20 to 140 nm with step increases of 20 nm (see Fig. 3). The results show that the peak intensities of three fluorophores ascend with the increase of Δλi, at first, and then drop at different intervals (see Figs. 2a and 3). The FWHM of S3 profiles for all fluorophores expands at a consistent rate with the increase of Δλi, and when Δλi reaches 120 nm, the NADH signal almost takes over the flavin signal.
The results detailed in Figures 2 and 3 show that the optimal Δλi should be as small as possible if resolution is the only consideration. However, in order to enhance the signal-to-noise ratio (SNR), the optimal Δλi should be chosen as close as to Δλss. In particular, application in breast cancer detection, the alterations of fluorophores due to the cancer development direct an optimal Δλi. In the spectral analysis on cancer detection, it is very difficult to calculate the absolute concentration of the fluorophores. One needs to find a stable reference to observe changes in the fluorophores of interest.
Evidence of an increase of tryptophan and a decrease of collagen in cancerous tissue demonstrate that S3 is superior to other approaches. Because the Δλss is ~40–50 nm for collagen and ~70–80 nm for tryptophan, Δλi = 40 nm should be chosen as an optimal scan wavelength interval because it provides balance between resolution and the SNR. Furthermore, the S3 with Δλi = 40 nm investigates the signal from tryptophan and collagen in tissue, which change inversely in cancerous and normal tissues. Therefore, the S3 with selective Δλi = 40 nm highlights the difference between cancerous and normal tissues and causes the two inverse spectral properties exhibited by Figure 1.
It is worth noting that S3 actually acquires the signal of fluorescence. The S3 profile of each biomolecule is determined by corresponding peak positions of absorption and emission. The difference between the emission and absorption peaks is known as the Stokes shift interval, Δλss, and when synchronized scan wavelength shift interval Δλi approaches the Δλss, the S3 signal magnitudes will access the maximum. Where Δλi crosses Δλss, the intensity of S3 will fall. The S3-related parameters of different fluorophores of interest are listed in the table. As a comparison, the values of Δλdrop for the fluorophores observed in our experiment are also listed.
The S3-related parameters of key fluorophores can explain the changes of the S3 peak intensities with Δλi in relation to those fluorophores. When S3 is acquired by Δλi = 20 nm, the excitation of all three fluorophores is far from the Δλss, which results the smallest S3 signal intensity. Because the Δλss of flavin and tryptophan is ~70 nm and ~70–80 nm, respectively, the magnitude of S3 signals from these two fluorophores is boosted with the increase of Δλi within the range of Δλss at first, but the intensity drops at Δλi = 60 nm for flavin and 80 nm for tryptophan after it exceeds their Δλss. This is the same reason that the peak intensity of NADH regresses at Δλi = 120 nm after it increases. The observed Δλdrop is in good agreement with Δλss.
Efficient and effective
This work demonstrates that the S3 measurements can acquire information for different key fluorophores in one scan. It also demonstrates that S3 can effectively investigate the changes of the relative contents of the key fluorophores in breast, prostate, and lung tissues related to cancer development. In summary, then, the S3 method offers an efficient way to rapidly measure spectral fingerprints of complex mixtures such as tissue, and adds to the armamentarium by highlighting differences between normal tissues and those affected by cancer and other diseases.
REFERENCES
1. R. R. Alfano et al., IEEE J. Quantum Electron., 20, 1507 (1984).
2. R. R. Alfano and Y. Yang, IEEE J. Quantum Electron., 9, 148 (2003).
3. Y. Pu, W. B. Wang, G. C. Tang, and R. R. Alfano, J. Biomed. Opt., 15, 047008 (2010).
4. H. J. G. Bloom and W. W. Richardson, Br. J. Cancer, 11, 359 (1957).
5. G. Fenhalls, D. M. Dent, and M. I. Parker, Br. J. Cancer, 81, 1142 (1999).
Editor's note: This article first appeared in the November/December 2012 issue of BioOptics World, and is drawn from the paper published in Optics Letters, 37, 16, 3360 (2012).
About the Author
Yang Pu
Yang Pu is a postdoctoral scholar at the Institute for Ultrafast Spectroscopy and Lasers (IUSL) and the departments of electrical engineering and physics at City College of the City University of New York (CUNY; New York, NY).
Wuabo Wang
Wuabo Wang is a senior research associate in the Department of Physics at City College of the City University of New York (CUNY; New York, NY).
Yuanlong Yang
Yuanlong Yang is a former research fellow in the Department of Physics at City College of the City University of New York (CUNY; New York, NY).
Robert Alfano
Robert Alfano is a distinguished professor of science and engineering at the City College of the City University of New York (CUNY), where he is the director of Institute for Ultrafast Spectroscopy and Lasers. He works primarily in the field of biomedical imaging and spectroscopy, and is known for discovering the white light supercontinuum laser. He has published more than 700 papers in referred journals and has over 100 patents, and has won numerous awards including the SPIE’s inaugural Britton Chance Biomedical Optics Award.