NUMERICAL MODELING: Optical-trapping map shows trapping efficiency in 3D
Optical trapping of small transparent dielectric particles with a focused laser beam has become important in areas such as nanoassembly and bioscience. The strength of optical trapping of microspheres made from polystyrene and other materials depends on three parameters: the particle radius, the refractive-index ratio of the particle to the surrounding medium, and the numerical aperture (NA) of the focused laser beam. For some parameter combinations, the particles are strongly or weakly trapped; for others, they cannot be trapped at all.
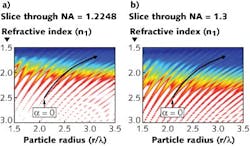
Now, researchers at Monash University (Clayton, Australia) have for the first time calculated trapping strength of dielectric microspheres as a function of these three parameters, allowing them to create a 3D map of trapping strength.1 Two-dimensional slices can be taken through this volumetric map to visualize trapping strength as a function of any two parameters; the result is often a very complicated map, showing strange serrated “ridges” whose borders define particle trapping vs. nontrapping.
In the model, the laser beam is assumed to be Gaussian and circularly polarized, and the surrounding medium is water (refractive index of 1.33). The numerical model takes into account near-field diffraction effects (important for particles on the order of a few wavelengths or less in size), and is valid down to sphere diameters of one wavelength.
The simulation was run at a high-performance computing facility and took advantage of up to 1408 central processing unit (CPU) cores and about 4.4 TB of random-access memory (RAM). A parameter grid of 9.8 × 10⁶ points and a computation speed of about 12 s per parameter, per thread necessitated batch parallelization to reduce computation time to something reasonable.
The 3D map’s “isosurface” has a clamshell curve laced with ridges. Outside of the surface, particles cannot be trapped, even in locations between the ridges. Inside the surface, the trapping strength is generally larger for locations farther from the surface.
The map gives the viewer a powerful tool for the design of optical-trapping systems (and conversely, systems that are intended not to trap particles). In just one example, some optical traps must contend with particles (for example, microbeads containing drugs to be targeted to certain cells) that absorb water over time, changing the particle’s refractive index and radius. Placing the particle’s parameter-change trajectory on a 2D slice of the map allows the researcher to determine whether or not the particle will remain optically trapped (see figure).
“The trapping map comes in very handy when there are two simultaneous parameter changes,” says Tuck Wah Ng, one of the Monash University researchers. “By being able to dissect at different planes of the map, the desired parameters can be checked to be sure that the ability to trap is not lost throughout the process. The map also revealed that the ability to trap (or not) manifests as ridges in the three-parameter space. We think that these regions may be harnessed to achieve sensitive sorting of particles.”
Code is available
“Based on the modeling done, we now have a comprehensive database that we can interrogate from,” says Ng. “At this stage we have provided a straightforward interface that researchers can use to browse the calculated data sets. At each data point we have stored various parameters, such as the scattering coefficients and the trapping force profile along the z-axis. This code is available for researchers to modify as they wish in order to query the data set in the format and nature of their choice. The simulation code that we have developed to conduct parallel computation is available, but is hardware specific. Hence, it may not be of particular use to researchers wishing to do the same on their own configured hardware.”
As in most computer simulations of optical effects, the program does have limitations. “One of the limiting theoretical aspects of any scattering problem is the correct representation of the input beam,” notes Ng. “Tightly focused beams are far more difficult to represent physically in scattering problems. At high numerical apertures, the traditional Gaussian representation may not satisfy Maxwell’s equations. It is possible to apply higher-order expansion terms of Davis’ perturbation approach (seventh or ninth order) for a more physical and closer solution to Maxwell’s equations. Numerically, however, there is a smaller radius of convergence with higher orders, which naturally poses computational challenges.”
Ng adds that the modular nature of the generalized Lorenz-Mie theory will allow the researchers to create maps for spherical particles that exhibit birefringence as a next step. They also expect that a Debye-series type study will provide further insight as to why the ridgelike trapping sites occur in the first place.
“We are at the moment planning experiments to verify the sensitive sorting capacity promised at the ridgelike regions,” he adds.
REFERENCE
1. M. Muradoglu and T. W. Ng, Appl. Opt., 52, 13 (May 1, 2013).
About the Author
John Wallace
Senior Technical Editor (1998-2022)
John Wallace was with Laser Focus World for nearly 25 years, retiring in late June 2022. He obtained a bachelor's degree in mechanical engineering and physics at Rutgers University and a master's in optical engineering at the University of Rochester. Before becoming an editor, John worked as an engineer at RCA, Exxon, Eastman Kodak, and GCA Corporation.

