SOFTWARE & COMPUTING: Advanced SPEOS software quantifies and visualizes stray light
GÜNTHER HASNA
Infrared (IR) surveillance systems are used in satellites that survey the earth’s surface to carry out environmental analysis—for example, to monitor marine pollution or study the movement of tectonic plates to help predict earthquakes. But more recently these systems are also being used for terrestrial applications in border control and other areas of homeland security. Infrared camera sensors are also finding their way into automobiles to help drivers avoid serious accidents at night and in adverse weather conditions.
For all these systems it is extremely important to have the best visibility—using as much light as possible but avoiding stray light in order to get good contrast and optimize detection. Stray-light simulation tools such as SPEOS or OptisWorks from OPTIS (La Farlède, France) can predict the imaging contrast of such IR surveillance systems by taking into account the physical parameters of lenses and sensors during the design to optimize system parameters and reduce costs.
Stray-light culprits
In the field of IR imaging, lens systems are based on materials like germanium (Ge) or zinc sulfide (ZnS). The reflectivity of each material depends on its refractive index. For standard glass with a refractive index (n) around 1.5, the reflection on each glass/air interface is around 4%, meaning that 8% of the light hitting a lens is reflected, generating stray light. In the case of Ge or ZnS materials with a refractive index between 3 and 4, the reflection on each face can be as high as 20%. This reflection coefficient is calculated in the ray-tracing software SPEOS by applying the Fresnel formulas for optical polished surfaces.1 For visible optics, coatings can reduce the stray light from Fresnel reflection; however, these coatings are very costly in the case of IR optical systems. Reflected rays bounce to other lenses and can generate—in the worst case—a second focus on the image such that the signal is wiped out by these secondary, mostly blurred, peaks.
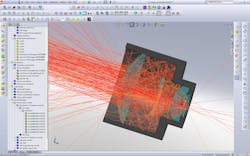
The second cause of stray light is light scattering on the mechanical elements around the lenses (see Fig. 1). Even though these elements should be painted black, reflectivity at IR wavelengths is not necessarily reduced using this method. For example, anodized aluminum may be black in the visible spectral range, but this is not the case for near-infrared (NIR) spectra. The reflection and scattering coefficients of mechanical surfaces can be qualified by measurements made on the OPTIS OMS4—a complete workstation that accurately captures and characterizes the materials, surfaces, and light sources in the imaging system being developed. In this system, the sample is lit by a laser beam at different incidence angles and the scattered reflected and transmitted light distribution is measured by a sensor rotating in two axes around the sample (see Fig. 2). The OMS4, working in conjunction with CAD-integrated software such as OptisWorks, can help the mechanical designer work closely with the optical engineer to improve the imaging system design based on its measured physical parameters.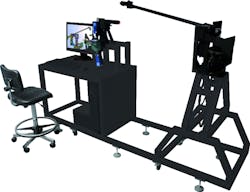
The third cause of stray light is the IR emission that occurs when the mechanical and optical elements are heated by the sun or the electronics of the system. Again, CAD-integrated simulation software is a big help because the temperature of the elements can be calculated using computational fluid dynamics (CFD) simulation tools integrated within the software. Once the temperature distribution is known, it is easily converted by OPTIS software tools into an IR-emitting light source just by knowing the absorption coefficient and the temperature and applying the Max Planck and Stefan Boltzmann laws.2
Measuring surface scattering properties (BRDF)
To obtain simulation results with high precision, one needs to have high-quality inputs for the physical parameters of the elements that the simulation takes into account. This is even more true for nonsequential ray-tracing software like SPEOS or OptisWorks. Nonsequential ray tracing means that several interactions are included in the beam simulation. For example, if the error on the absorption of the metal housing is 10%, a ray hitting this mechanical element just once also has an uncertainty of 10%. If this ray is hitting the same surface twice, the uncertainty is multiplied to an error of around 20%; in fact, the error rises exponentially with the number of interactions.
To eliminate this issue, OPTIS developed radio-goniometer hardware for the OMS4 that accurately evaluates the physical parameters of the elements used. A surface or material sample is illuminated by a high-quality laser beam and a photomultiplier tube (PMT) measures the stray light in all angular directions around the sample. Using surface optical parameters (SOPs), a bidirectional reflectance distribution function (BRDF) or a bidirectional scattering distribution function (BSDF) can be measured to describe the scattering effect of surfaces.3 The BRDF and BSDF files can be seen as value tables, which contain the optical answer of the surface or volumes in incoming light. The software user can drag and drop these descriptions to the selected CAD faces; the software automatically searches for the correct values from the table. When describing volume optical properties (VOPs), the scattering is dependent on the impurity of the material causing the scatter on each volume particle. This scatter can be modeled and measured using a double Henyey-Greenstein equation.4
The OPTIS hardware/software combination can measure BRDF/BSDF to better than ±0.01° resolution with a signal-to-noise ratio (SNR) for the BRDF better than 107. As such, it is possible to get a high-definition BSDF and, consequently, achieve a high level of precision in stray-light analysis.
SPEOS Light Expert function
The core of the SPEOS and OptisWorks nonsequential stray-light analysis simulation software is the Light Expert (LXP) module containing the Light Path Finder (LPF) function. The process begins by modeling the entire IR sensing system—optical and mechanical parts as well as the sensor itself—using the software’s CAD tools. To model the surface and volume optical properties, a large library of standard data is available within the SPEOS software. If some special material has been used it can be qualified using the OMS4. Next, it is necessary to model the scene by using a high-dynamic-range (HDR) environment wrapped around the optical system or an emitting bitmap. An HDR environment contains the luminance values of the ambience and is wrapped around the geometry. The high dynamic range is necessary to give a natural effect of the ambient light, which can be different for directional sources, such as sunlight, and diffuse light, as seen in cloudy skies. For testing, it is best to simulate a laser source by using a surface emission that is lighting the lens system from a given direction in space. The sensor is modeled by measuring the energy striking each pixel in watts per square meter as a function of wavelength.
The simulation begins by detecting and saving into a file the ten most probable nonsequential sequences of rays through the system. Then, a radiometric ray-tracing step using millions of rays is executed and the interaction of all rays with the optical and mechanical faces ordered by the most probable path is saved into a special LPF file. Because it would be impossible to manually analyze the gigabytes of data collected, special information processing is necessary to limit the memory consumed by this data set. In the third step, an interface allows the LXP function to select the sequence and the spectral range to be analyzed in order to highlight the stray-light hot spots. The physical causes for these hot spots can then be visualized using simple graphics in the CAD file, demonstrating the reverse-analysis capability of the LXP tool (see Fig. 3).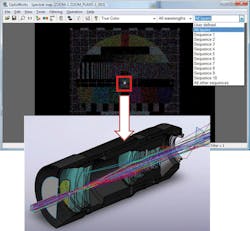
It is also possible to calculate the SNR using the LXP function and a photometric calculator. OPTIS clients say that this SNR result typically matches exactly with measured stray-light data. This LXP function thus helps to reduce the number of real system prototypes in development, reducing development time and cost as it is always preferable to have multiple design changes at the start of the development process than at the end. The interface and the speed of the LXP simulation function enable users to test many system variants in a short timeframe.
Other applications
Stray-light analysis and simulation are not only helpful in the development of optics but also in areas such as general lighting and medical instrumentation. In a lighting application, the optical lenses are simply replaced by reflector parts with their own surface-scattering description. And in medical applications such as laser skin treatments, the volume scattering parameters of the skin can be analyzed in order to develop beam-delivery systems that will not damage healthy cells adjacent to those being treated.5 Other medical applications of note include analysis of the scattering properties of the human eye that change upon aging and affect our night-vision capability, and analysis of the scattering profile of fluorescent markers whereby the different traveling times of the scattered photons through tissue can be used to obtain clearer images of cancerous tumor cells.6,7
REFERENCES
1. H. Naumann and G. Schröder, Bauelemente der Optik, Carl Hanser Verlag, Munich, 30–37 (1992).
2. L. Bergmann and C. Schäfer, Lehrbuch der Experimentalphysik, Band 3, Optik, Walter de Gruyter, New York, 624–641 (1993).
3. ASTM standard E1392-96, “Standard practice for angle resolved optical scatter measurements on specular or diffuse surfaces” (2002); www.astm.org.
4. T. Binzoni et al., “The use of the Henyey-Greenstein phase function in Monte Carlo simulations in biomedical optics,” Phys. Med. Biol., 51, N313–22 (2006).
5. “How a Laser Skin Treatment Works”; http://bit.ly/9T2ZjJ.
6. G.L. Heijde et al., “Effects of straylight on visual acuity in pseudophakia,” Documenta Ophthalmologica, 59, 1, 81–84 (1985).
7. A. Shahzhad et al., “Emerging applications of fluorescence spectroscopy in medical microbiology field,” J. Translational Med., 7, 1, 99 (Nov. 26, 2009).
Günther Hasna is chief technology officer at OPTIS, Zone d’Entreprises de La Farlède, 60 Rue Parmentier, 83210 La Farlède France; e-mail: [email protected]; www.optis-world.com.