OPTICAL COHERENCE TOMOGRAPHY: OCT supports industrial nondestructive depth analysis
PATRICK MERKEN, RAF VANDERSMISSEN, and GUNAY YURTSEVER
In a remarkably short time, optical coherence tomography (OCT) has evolved to become a standard noninvasive biomedical technique that yields detail-rich cross-sectional images of living tissue. The technique has spread within the medical arena with breathtaking speed and is now moving into the industrial marketplace. Promising industrial applications of OCT include cost-efficient quality improvement tools for inline inspection of multilayered objects in manufacturing processes.
The enormous commercial potential of OCT is evidenced by a September 2010 report from the Millennium Research Group (Toronto, ON, Canada).1 According to the group’s five-year forecast, the OCT market will see average annual growth rates of 60%—though it should be noted that this estimate is based primarily on the medical markets that have emerged as the first broad application area of OCT since its introduction in 1991 by James Fujimoto at the Massachusetts Institute of Technology (Cambridge, MA).
At that time it became immediately clear that OCT can deliver detail-rich images from the deeper layers of living tissue, which is of special value and utility to ophthalmologists. Now a multitude of other medical applications are emerging, such as measuring the thickness and uniformity of functional layers in pharmaceutical products—important for the controlled dispensing of certain drugs, the examination of blood vessels, and three-dimensional imaging of the kidneys.2
Looking forward, OCT imaging will likely have a significant impact on many established medical procedures, possibly changing current standard practices. Just one example: Today’s “gold standard” in the early detection of cancerous growth in the larynx is based on performing a biopsy—the extraction of a small, suspicious piece of tissue and treating it to a microscopic examination in the lab. Biopsy of the larynx is, however, a seriously invasive procedure, requiring local anesthesia, and can leave the patient permanently hoarse.
When combined with video laryngoscopy, OCT offers a much milder alternative, replacing the intrusive biopsy with an outpatient tomography of surface and deeper tissue irregularities. There is no need for anesthetics or direct physical contact with the affected tissue. This example is also a good pointer to the potential industrial uses of OCT, where similar examination constraints may apply. In industry, the advantages of OCT will come in the form of cost savings and quality improvement realized through an accelerated process flow.
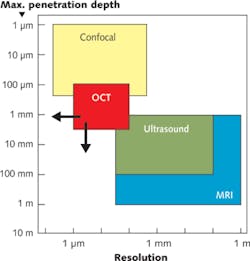
As a high-frequency analog to, and a possible replacement of, ultrasound-based examination techniques, OCT delivers images of a much higher resolution—well into the micrometer realm. The penetration depth achievable with OCT is determined by the type of material under test and the wavelength used (see Fig. 1). Penetration by OCT can reach beyond 6 mm. Thus, OCT is able to bridge the realms of confocal microscopy and ultrasound, as well as other computed tomography (CT) methods such as magnetic resonance imaging (MRI).OCT: The basics
Optical coherence tomography delivers cross-sectional images from within samples without the need to touch or damage the sample (see Fig. 2).3 Hence, the technique promises innovative methods for industrial applications such as quality assurance and process control. Real-time OCT can monitor continuous manufacturing and assembly processes. The technique is based on the interference between light directly from a source striking the object under test with the light reflected by the object through a semitransmissive mirror or beamsplitter (see Fig. 3).Of the many possible ways to achieve this interference, the most common configuration is spectral-domain OCT using a spectrometer. Here, a broadband light source radiates light of a low coherence length through a semitransmissive mirror onto the test object. A part of this beam is reflected by the beamsplitter and guided to a reference mirror, which feeds the beam via the semitransparent mirror to the input of a spectrum analyzer. The light reflected by the test object then interferes with the reference beam. As a result, the spectrum analyzer outputs the spectrum of this interference pattern, which is then converted by an optoelectronic line sensor to an electrical intensity signal. From this spectral information, a Fourier transform generates the appropriate spatial intensity data. A disadvantage of this arrangement is the relatively large travel range of the mirror, which can be several millimeters, needed to cover the entire intended examination depth within the test object.
Considerably faster is full-field OCT, which produces tomographic images in the en face orientation (orthogonal to the optical axis) without scanning a light beam.4 Here, the entire field of the image is illuminated with low spatial coherence light. The tomographic images are obtained by combining interferometric images acquired in parallel using a two-dimensional (2D) image sensor. Full-field OCT, sometimes referred to as full-field optical coherence microscopy, is essentially an interference microscope illuminated by a simple white-light source, such as a tungsten-halogen lamp.
One possible arrangement is based on a Michelson interferometer with identical microscope objectives in both arms (see Fig. 4). Several interferometric images are acquired successively with the 2D camera, with the phase being changed in the interferometer between each image acquisition. The phase shift is accomplished by displacing the reference mirror with a piezoelectric actuator. The tomographic image is then calculated by combining these interferometric images in a higher-order polynomial.The calculation of the polynomials and the Fourier transform suited for both the line sensor camera and the 2D camera can be done by a regular multipurpose computer with appropriate programming or via a dedicated hardware solution based on a field-programmable gate array, which performs just this one function, but very rapidly.
OCT in process control
In an OCT demonstration, a three-layer plastic part—about 2.3 mm thick—that serves as the wall of a liquid container was chosen as a test object. The part consists of a high-density polyethylene material plus a thin 100 μm layer of ethyl vinyl alcohol (EVOH) as a diffusion barrier. The Fraunhofer Institute for Laser Technology (Aachen, Germany) has investigated the properties of this structure in the context of a project to explore resource-saving manufacturing methods in the plastics industry.5
The objective was development of an “Interferometric Inline Control System in the Production of Multi-layer Plastic Foils.” Optical coherence tomography is used to measure the thickness and uniformity of individual thin layers in real time during a production run. Besides achieving significantly higher process security, the Fraunhofer researchers say that this OCT-enabled control technique should save material supplies amounting to €100,000 (US$143,000), even when deployed in a medium-capacity production facility.
At first glance (and at visible wavelengths) these plastic foils and the containers made of them appear relatively opaque. However, this optical surface barrier can be penetrated by light in the near-infrared (NIR) realm. The consequent absorption spectra are characteristic for a given material and allow a secure differentiation of various molecular structures.
For the measurement of these NIR spectra, CMOS or CCD image sensors are inappropriate since their sensitivity is limited to visible wavelengths. Indium gallium arsenide (InGaAs) sensors, however, offer a significantly better NIR response. These sensors are currently available as linear detectors (such as Xenics’ Lynx linescan camera) with up to 2048 pixels, and as a 2D camera (such as Xenics’ Cheetah-640 CL), which has 640 × 512 pixels.
The high resolution achieved by the line sensor is extending the application area of OCT into higher spatial resolution (as indicated in Fig. 1 by an arrow pointing to the left), while the 2D camera, which delivers 1730 full frames/s, transforms OCT into a dynamic, real-time control method for manufacturing processes. These sensors come standard with one-stage thermoelectric cooling, but if a very high signal/noise ratio is required to increase penetration depth (indicated in Fig. 1 by an arrow pointing downward), the camera cooling can be upgraded to three-stage thermoelectric cooling.
With these different sensor types to choose from, together with flexible electronics packages and multistage thermoelectric cooling, current InGaAs cameras are scalable OCT platforms. They are suited to a host of scientific, industrial, and medical applications and enable direct imaging and spectroscopy. Most important, they include sensors that deliver a resolution of or below 1 µm, at a penetration depth greater than the current standard of 6 mm. System designers can implement OCT as a meaningful and detailed analysis tool for nondestructive testing and monitoring of hidden structures to increase quality, throughput, and yield in manufacturing processes.
REFERENCES
1. “OCT market forecasted for 60% annual growth through 2015,” Bio Optics World online (Sept. 16, 2010); http://bit.ly/qBQlVU.
2. L. Morgus, “Optical coherence tomography finds value in both art and science,” Laser Focus World online (Aug. 23, 2010); http://bit.ly/d2nbzh.
3. B.G. Goode, “OCT aims for industrial application,” Laser Focus World, 45, 9, 41–45 (September 2009).
4. A. Dubois and A.C. Boccara, “Full-field Optical Coherence Tomography,” Chapter 19, in Optical Coherence Tomography: Technology and Applications, eds. W. Drexler and J.G. Fujimoto; Springer (2008).
5. Fraunhofer ILT, “Optische Kohärenz-Tomographie in der kunststoffverarbeitenden Industrie”; http://bit.ly/q6uEgz.
Patrick Merken is CTO at Xenics NV, Leuven, Belgium; e-mail [email protected]; www.xenics.com. Raf Vandersmissen is CEO at Sinfrared, Singapore. Gunay Yurtsever is a PhD student at Ghent University, Belgium.


