FIBER-OPTIC TEST & MEASUREMENT: Coherent communications systems demand rigorous polarization testing
STEVE YAO
Much of the recent focus in optical network development has been on ways to cost-effectively extend the transmission reach and data capacity of legacy 10 Gbit/s networks. Coherent detection and polarization-division multiplexing have emerged as key technology enablers for 40 and 100 Gbit/s networks. The combination can significantly increase the spectral efficiency of a channel and allow each channel to transmit higher bit rates with a relatively small optical bandwidth. Now, 40, 100, or even 160 Gbit/s channels can be transmitted using existing 10 Gbit/s wavelength-division multiplexing (WDM) infrastructure with 50 GHz channel spacing.
Polarization-division multiplexing (PDM) doubles the spectral efficiency by combining two polarization channels of the same bit rate into the same wavelength channel. Coherent detection allows multiple levels of phase and amplitude modulations of lower rates to be multiplexed on the same wavelength channel using advanced modulation schemes. For example, the use of PDM with quadrature-phase-shift-keying (QPSK) modulation enables 40 Gbit/s transmission within the bandwidth of a 10 Gbit/s direct channel. The effect of impairments due to polarization mode dispersion (PMD) and chromatic dispersion (CD) is commensurately reduced.
Because coherent detection retains the phase, amplitude, and polarization information of the signal, such systems are able to handle the polarization demultiplexing in the electrical domain using high-speed digital signal processing (DSP) circuitry and algorithms. Important system impairment correction functions such as CD compensation, PMD compensation (PMDC), and polarization-dependent loss compensation (PDLC) can also be handled electrically; however, system performance must always be verified.
Verifying system performance
For transceiver developers, successful development requires performance evaluation of different DSP circuits and algorithms. For system integrators in the market for transceivers, it is important to compare performance of transceivers from different vendors. Finally, for network operators, evaluation and comparison of the performance of systems from different vendors can help an operator make intelligent purchasing decisions. In all of these cases, the evaluations must include three principal polarization-related functions: polarization demultiplexing, PMDC, and PDLC.
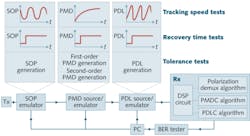
For a coherent detection system, a general setup can be developed for testing the performances of all polarization-related functions (see Fig. 1). Note that because polarization impairments vary rapidly with time, the related functions must be tested against variations in different polarization parameters, such as the state of polarization (SOP), PMD, and PDL. To properly test these parameters, it is important to understand the definitions of different polarization-related performance tests for coherent detection systems. These evaluation tests include three basic types: tolerance range, tracking speed, and recovery time (see Fig. 2). The bit-error rate (BER) of the system is used as the performance indicator, although other parameters, such as the size of the opening in an eye diagram or the power penalty, can be used as well.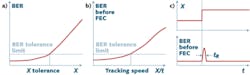
A tolerance range test can determine the maximum amount of the impairment under test (PMD or PDL) that can exist in a system before the signal quality degrades beyond an acceptable level. As these impairments increase, the BER increases. The PMD or PDL corresponding to the maximum allowed BER is the system tolerance range.
Unlike CD and signal-to-noise ratio, SOP, PMD, and PDL all vary rapidly with time in a real fiber-optic communication system. A tracking speed test determines how rapidly a parameter under test can change before the circuit/algorithm being evaluated can no longer follow the variation, causing the signal quality to degrade beyond a given level. In a tracking speed test using the BER before forward-error correction (FEC) as the performance indicator, the tracking speed of the circuit/algorithm under test is the variation rate of the parameter under test (such as SOP, PMD, or PDL) corresponding to the maximum allowed BER.
A sudden change in SOP, PMD, or PDL can cause the circuit/algorithm under test to temporarily lose track, causing a transient increase in BER. A recovery time test determines how quickly the circuit/algorithm under test can recover from the change, restoring the BER to an acceptable level. In particular, SOP, PMD, or PDL recovery time is defined as the time tR required for the DSP to restore BER from an abnormal level caused by a disruptive jump for each of these three parameters.
Polarization test instrumentation
The entire ecosystem for coherent detection systems—transceiver designers, system integrators, and network operators—must ensure performance of their solutions, and the proper polarization test instruments must be used to make sure that their system specifications are being quantified and met.
A PMD tolerance range test requires a PMD source and emulator. A personal computer is used to control the source, and a test program can be developed to plot the BER obtained from the BER tester as a function of PMD values. The source must be able to generate precise, repeatable first- and second-order PMD values with a broad enough range to determine the limits of the compensation circuit/algorithm. Since the effect of PMD on the system is polarization dependent, a SOP emulator should be used to vary the input polarization to the source in order to make sure that the worst case is covered. The SOP emulator can either be integrated into the PMD source (as with General Photonics' PMD-1000) or it can be a separate instrument, and should be able to generate random SOP variations with user-defined speed to uniformly cover the Poincaré sphere.
A PDL tolerance range test requires a PDL source and emulator. Analogous to the PMD tolerance range test, the PDL source must be able to generate precise, repeatable PDL values over a range sufficient to determine the PDL limit. A PC with a test program can be used to control the generation of the PDL values from low to high and plot the BER as a function of PDL. Again, an SOP emulator should be used in front of the source to ensure that the worst-case SOP is reached for maximum PDL-induced signal distortion.
For an SOP tracking speed test, the SOP emulator should be able to generate smooth, random SOP variations at a user-defined rate. The BER before FEC is used as the performance indicator to ensure sufficiently high testing speed. Again, a PC with a test program can gradually increase the SOP scrambling rate while recording the BER, and finally obtain the plot of BER before FEC versus SOP scrambling rate and the final SOP tracking speed. The maximum SOP variation rate should be 0.5 kHz or more to emulate variations in a real system. As mentioned previously, for PMDC using DSPs in a coherent system, the circuit/algorithm must track SOP variations and rapid PMD changes. To test a PMDC's PMD tracking speed variation, the source must be able to generate smooth, fast PMD variation at a user-defined rate and range. A test program can be used to gradually increase the PMD scanning rate while recording the BER before FEC for each rate. The maximum PMD scanning speed required is 100 ps/s or more to ensure statistically realistic coverage of PMD variation speeds in a real system.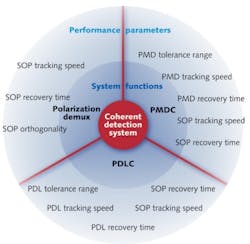
Finally, to test the PDL tracking speed of the PDL compensation circuit/algorithm, the PDL source must be able to generate fast PDL variations with user-selectable rate and range. To date, the only instrument on the market with this functionality is the General Photonics PDL-101. As with SOP and PMD tracking speed test methods, the PDL tracking speed can be obtained by plotting the BER before FEC versus PDL scanning rate.
To determine how quickly the circuit/algorithm can recover from an abrupt change in the parameter under test, the emulation instrument must be able to generate such a change significantly faster than the circuit can respond. When the parameter change occurs, the BER may fluctuate as the system loses track. The amount of time the system needs to return the BER to a stable level can then be measured. For an SOP recovery time test, the emulator must generate large SOP discontinuities periodically in less than 0.1 ms while the BER before FEC is recorded and displayed. Then the SOP recovery time tR is readily obtained by measuring the duration of the period before BER recovery. For PMD and PDL recovery time tests, the corresponding sources must similarly be able to generate fast, repeatable PMD or PDL transitions in less than 1 ms while BER before FEC versus time is recorded and displayed; PMD and PDL recovery times are obtained from the BER before FEC versus time plots.
It is important to be aware of instrument limitations in order to select instruments to suit particular testing needs. For example, instruments that rely on mechanical motion are bandwidth limited. These units can only generate variations up to 3 Hz, which may not be adequate for testing modern systems.
Steve Yao, PhD, is president, CEO, and CTO of General Photonics Corp., 5228 Edison Ave., Chino, CA 91710; e-mail: [email protected]; www.generalphotonics.com.