IR OPTICS: Ultrabroadband optics image from visible to longwave IR
CHRISTOPHER ALEXAY
As the number of applications for multispectral imaging grows, so too does the need for more advanced optical systems to capture, deliver, and transmit this value-rich information. However, traditional optical approaches do not lead to a means for simultaneously imaging large regions of the electromagnetic spectrum, or even disparate regions, via a common optic.
The design of multispectral imaging systems has long been dominated by approaches that rely primarily if not entirely on reflective surfaces. Although mirrors are inherently achromatic, in many instances reflective designs have drawbacks that make them a poor choice for use in challenging imaging systems. Reflective geometries are best suited to systems requiring narrow to modest angular fields; even so, in many instances such designs contain obscurations.
Designs free of obscurations can be formulated in a multimirror form. A good example is the three-mirror anastigmat, which has found widespread use since its introduction. Its primary drawback is that it can require considerable space and a complex architecture to achieve its function. Once a designer has chosen a refractive over a reflective form, he or she now must contend with the challenges of chromatic errors produced by the refractive medium itself.
Higher-order chromatic aberrations
Chromatic dispersion is the change of an optical material's index of refraction with wavelength. In almost every case, the refractive index of a medium decreases as the wavelength increases. If not corrected for, dispersion can limit the spectral range over which satisfactory imaging can occur in a refractive design.
The time-tested way of minimizing the dispersive characteristics of an optical design is to marry two differently powered materials with different dispersive values (quantified by their V-numbers) to formulate a matched pair capable of delivering a satisfactory image corrected for at least two wavelengths in the spectrum of interest. The optimal selection is two materials whose V-numbers differ enough to avoid inducing higher-order aberrations into a design.
This approach, however, does not work well for optical systems with very wide spectral ranges. The nonlinearity of a material's dispersive function is one of the primary contributors to the aberrant imaging in wider-band optical systems; it will most often manifest itself in a form of higher-order chromatic aberration or nonlinear residual color that can be extremely difficult to control. This less-well-known family of aberrations, most often considered a nuisance in designs for limited spectral ranges, becomes more severe as the spectral range of the design is enlarged.
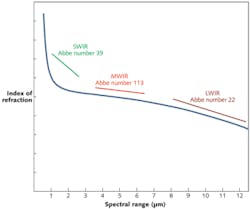
Consider the properties of the material Cleartran, a water-free form of zinc sulfide (see Fig. 1). The three primary regions of spectral interest are the shortwave infrared (SWIR), which roughly corresponds to the region bounded by 0.7 to 1.9 μm; the midwave IR (MWIR), which ranges from 3.0 to 5.0 μm; and the longwave IR (LWIR), which ranges from 8.0 to 12 μm. Within each of these sub-regions, the rate of change calculated via the more traditional V-number methods indicates that the behavior deviates significantly as indicated by three distinct slope approximations. A designer searching for a suitable combination of materials for any of these regions would need to match two elements that have significantly differing V-numbers and at the same time similar partial dispersion. Any deviation of the two components from a common dispersive response leads to residual color and, thereby, degradation in image contrast and resolution. To now find a solution that spans all three regions, the designer would need to match each slope almost identically while again maintaining a favorable "crown-flint" style of relationship.
This is no easy task because the number of materials that are both transmissive across these regions and practical to fabricate is limited, so a means of identifying material recipes that are capable of complementing each other's nonlinearity and more specifically, volatility in dispersion across a vast spectral range, requires a fresh approach.
But settling for different optics for different bands is often not a good option, as sensor solutions are developed based upon minimized volume and weight goals; one obvious example is unmanned vehicle systems.
Multistep method
Overcoming the limitations of classical achromatic material identification requires investigating not only the dispersive aspects of a material over a spectral region but its volatility as well. To do this it is necessary to drill down beyond the cursory formulations of the dispersive nature via more rigorous mathematical treatments. For example, differential analysis using numerical methods can help reveal the true viability of a material's use for very divergent spectral correction. A linear multistep method uses a combination of n(λi) and n(λi') to calculate the instantaneous value of dispersion and its relative rate of change, namely the partial derivatives of the spectral response:
σn(λi)/σλi
The key to volatility, however, is looking beyond this first layer to that of the second stage, or a more precise multistep method using the previous steps to calculate the second-order partial derivative's value and thereby the volatility for any point along the spectral-response curve. Here, the desired increment is based on not only the material's general dispersive delta but also its predicted rate of change for each incremental step λn+i:
f' (λ) = lim h→0 ([f(n(λi+h)) - f(n(λi))]/h
What we are searching for is a material's natural resonance or response to the spectral energy. Its spectral response and the ability to identify any natural "frequencies" in its dispersive spectrum will allow a selection of the most natural pairings to deliver relaxed well-corrected super-achromatic performance across any finite region and, more important, will directly relate its capacity to remain as such over wider bands simply by increasing the spectral bandwidth of the analysis. Any nodal point in the second-order partial derivation is a maximization of the dispersive volatility and as such should ideally be matched to its complementary material in the achromat:
f"(λ) = lim h→0 ([f' (n(λi+h)) - f' (n(λi))]/h
In fact, this type of mathematical analysis is well-suited to statistical data reduction and is closely related to the forward difference equation for the first derivative. Using this and similar formulae to replace derivative expressions in differential equations, one can approximate their solutions without the need for indeterminate practices in calculus which can and do in certain circumstances lead to false presumptions.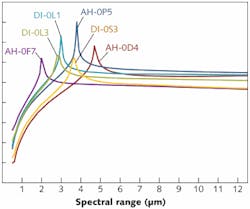
Compact image-fusion systems
The dispersive responsivity of several wideband transparent materials investigated by StingRay Optics engineers shows the potential for use in multispectral image-fusion applications (see Fig. 2). One key point worth noting is that any two materials that intersect each other in this analysis are in essence exchanging polarity in their complementary roles as they move through intersecting spectral regions. This can render such choices a poor selection. Furthermore, to avoid the higher-order aberrations that stem from strongly powered elements, it is best to identify pairings with the greatest difference in magnitude and nodal point so as to reduce their individual powers and lower strain in the final design's physical geometry. This is chiefly due to the fact that materials close in dispersive behavior require very steep curvatures to achieve achromatic solutions. Strongly curved surfaces can induce a host of issues ranging from higher-order aberrations to tighter tolerances, all of which translate to an increase in cost for the optical system.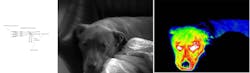
By departing from the standard approach to material identification for suitable pairings in favor of a more rigorous numerical method to both predict and counteract the nonlinearity of a material's dispersion and locate its dispersive harmonic, we have found opportune recipes, dubbed the SuperBand optic (see Fig. 3), for chromatically balanced imaging over spectral bands as wide and disparate as the visible to the far IR. This allows us to manufacture heretofore unrealizable optical systems that give integrators the tools needed to reduce space requirements and package size and weight for image-fusion platforms. Furthermore, with the advent of newer stacked-detector technology, this system can interface simply to these remarkably broadband receivers to deliver crisp images. In addition, the system can be modest in space and weight requirements as compared to systems requiring dual imaging channels or unobscured reflective imaging optics.
REFERENCES
1. W. Wolfe, "The Status and Needs of Infrared Optical Property Information for Optical Designers," Proc. SPIE (1990).
2. D. Dawes, "Sensor Fusion Payloads: The Key to Information Rich Imaging," Unmanned Systems (December 2009).
3. J. Nocedal and S.J. Wright, Numerical Optimization, Berlin/New York: Springer-Verlag (2006).
4. E. Suli, An Introduction to Numerical Analysis, Cambridge, England: Cambridge University Press (2003).
5. D. Malacara, Handbook of Lens Design, New York: Marcel Dekker (1994).
6. P. Klocek, Handbook of Infrared Optical Materials, New York: Marcel Dekker (1991).
Christopher Alexay is chief optical designer at StingRay Optics, 310 Marlboro St., Keene, NH 03431; e-mail: [email protected]; www.stingrayoptics.com.