VIBRATION CONTROL: How to determine your equipment needs
WARREN BOOTH
I recall someone once saying to me that "perception is reality." But say this to scientists or engineers who need to take experimental data at midnight because their lab equipment is sensitive to even the minutest vibration and they may tell you otherwise. The reality is that imperceptible vibrations can and do impact sensitive experiments, and identifying the sources and selecting the proper equipment to minimize their adverse affect is important.
Laboratories house a variety of vibration sensitive equipment used for research and production in fields such as laser based research, high-resolution imaging, semiconductor manufacturing, and biotechnology. Inserting electrical probes into nuclei of living cells, etching sub-micron lines in nanostructures, or taking SEM images requires laboratory environments to have vibration levels well below human perception thresholds. Floor vibrations can cause imaging components, specimens, lasers, or substrates to move relative to each other, causing blurry images, low yields, and erroneous results. The degree to which this relative motion affects results depends on the amplitude and frequency of the environmental vibrations as well as the sensitivity of the experiment.
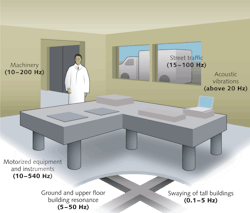
Ambient vibrations are omnipresent and can be grouped into two sources: internal and external sources. Common internal sources of vibration include foot traffic, flow excitation of air handling systems, unbalanced fans, vacuum pumps, and chillers. These sources can typically generate higher vibration levels than external ones. External noise sources are those coupled into the building structure itself and include elevators, ventilation motors, road and rail traffic, construction activity, and nearby heavy industry. Airports also can generate significant levels of low-frequency vibration noise (see Fig. 1).
The location of a laboratory within the building with respect to these sources and to the structure in general can also impact noise levels. Laboratories and equipment located on upper floors in multistory buildings can be exposed to building sway and structural resonances. The motion of elevators can cause low-frequency vibration noise, as can loading docks or overhead doors. As stated earlier, these vibrations can be below the threshold of human perception but still impact experimental or process results. Understanding the sources of vibration and quantifying their impact is a critical first step toward building any high-precision system. The most common method to measure laboratory vibrations is a basic site survey.
Site surveys
Generally consisting of multipoint floor measurements in both the vertical and horizontal planes, site surveys measure the magnitude and frequencies of lab vibrations. They can also include acoustic measurements to quantify any need for enclosures. The survey data would then be used to determine what type of vibration control equipment is required to reduce the vibrations to acceptable levels. Of course, having the right equipment and the experience to analyze the data is critical to proper selection of the protection needed.
Laboratory site surveys are typically conducted with equipment that includes ultralow-noise transducers and analyzers that are capable of measuring down to sub-micro-g levels with dynamic ranges wide enough to measure physical vibrations at sub-micron amplitudes and resonances that span from less than 1 Hz to more than 500 Hz. Common instruments used for measurements include the dynamic signal analyzer—two channel, real-time FFT (fast Fourier transform); ultralow-noise seismic accelerometer and amplifier with a measurement range of 0.05 to 500 Hz and capable of measuring sub-micro-g amplitudes; and a laptop computer. These tools generate the data needed to produce two key performance graphs, the 1/3 octave band and the PSD (power spectral density) plots.
1/3 Octave-band and PSD
Environmental (floor) vibration criterion curves have been developed on the basis of data from individual systems and measurements made in facilities both before and after vibration problems have been solved. Moreover, they have been used extensively by leading vibration consultants to the semiconductor manufacturing industry for almost 20 years, and have been extended and refined as the industry has moved to narrower linewidths. The criteria are specified as a set of "1/3-octave-band velocity spectra" that define guidelines for allowable vibration levels for various activities and equipment. One of the major benefits of these criterion curves is that vibration is expressed in terms of root-mean-square velocity instead of units of displacement or acceleration.
Various studies have shown that while individual equipment may show unique displacement responses to different frequencies, these points often reside on a curve of constant velocity. Moreover, the threshold constant velocity that affects the performance of equipment within each class tends to be rather uniform. Floor vibration in both manufacturing and research environments is typically dominated by random, "broadband" energy, as opposed to pure tone energy consisting of discrete frequencies. Although system resonances will be excited by both broadband and pure tone vibrations, the degree of their excitation will be different. Because random vibration closely approximates the measured floor vibrations observed in laboratories and manufacturing facilities, a specification based on random vibration more accurately reflects real-world applications. Evaluation of sites confirms that 1/3 octave vibration criteria accurately reflect typical environmental vibration spectra. The table describes the criteria curve/environmental rating levels as a function of detail size and application.
If the application requires working with feature sizes down to 0.1 mm (VC-E), however, vibration control equipment would be needed in order to achieve an environment conducive to this type of measurement. In this case, vibration isolators would be required to attenuate the floor vibrations. The type of isolator required depends on the results from the 1/3 octave site survey plot and the isolator's transmissibility. Transmissibility curves tell you how much vibration attenuation is provided at a given frequency provided the amplitude levels are above the frictional limitations of the isolator.
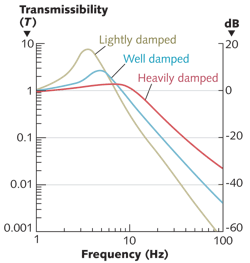
Vibration isolation can be achieved using springs, rubber pads, air-filled bladders, pneumatic self-leveling isolation legs, or active isolation systems using piezoelectric or electrodynamic elements. Each offers varying levels of capability, performance, and, of course, price. In most cases, isolation performance is measured by a reduction in noise (dB) or a transmissibility plot that illustrates the isolator's performance over a specified frequency range (see Fig. 3).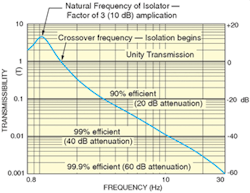
At the natural frequency of most optical table isolators, vibration is amplified by a factor of 10–12 dB. As the frequency increases beyond the isolator resonance, the transmissibility begins to fall sharply. Once the isolator transmissibility curve falls below unity transmission (0 dB), it begins to "isolate." As the curve rapidly descends, the low-pass mechanical filter becomes more and more efficient. By 10 Hz high-quality pneumatic isolators are filtering more than 95% of the floor vibration. By 100 Hz almost 99% of the vibration is filtered.
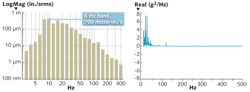
Selecting the proper equipment
The 1/3 octave velocity plot in Fig. 2 showed a VC-B environment with a 700 micro-in./s peak in the 8 Hz band. Is this environment suitable to work with feature sizes of 0.1 mm? Will a pneumatic isolator provide enough isolation to enable you to work with feature sizes down to 0.1 µm? To answer these questions, a transmissibility curve, in conjunction with a 1/3 octave plot, can be used to calculate attenuation as a function of frequency. In Fig. 5 we again show our transmissibility curve for a high-quality pneumatic isolator. At 8 Hz the isolator is approximately 96% efficient. The 8 Hz peak taken from the 1/3 octave plot will be attenuated to 28 micro-in./s, providing an environment well below a VC-E. Based upon the vibration criterion curve in the table, a VC-E environment is adequate for the most demanding of sensitive systems including long-path, laser-based, small-target, and other systems. In this case, even with the resonances in the room a high-quality pneumatic isolator like the Newport S-2000 Stabilizer series is able to provide an extremely stable environment and negate the effects of the resonances. The use of high-cost piezoelectric and/or electronic isolation equipment would not be necessary in this type of environment, and its additional performance could not justify its significantly higher cost.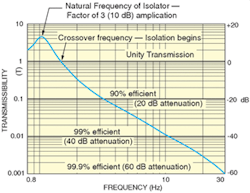
In summary, determining the amount of vibration reduction necessary for a specific application is ideally done through a measurement analysis of the environment and the actual elements within the application. This would include a vibration site survey using low-noise seismic accelerometers and possibly noncontact vibration analysis using laser Doppler vibrometers. The latter is an expensive and timely process reserved for only the most precise and demanding applications such as semiconductor wafer fabrication, interferometry, and holography. Generally, these applications need at minimum a pneumatic isolation system and highly damped optical table. In extreme cases an active isolation system or actively damped table may be required depending on whether the source of vibration is emanating from the floor or the table surface, respectively, and the magnitude of these disturbances.
A more popular and economical solution for moderately sensitive applications such as electron microscopy, multiphoton microscopy, and laser micromachining is to consult with a vibration control supplier, such as Newport, to determine if a basic site survey can be performed prior to final system configuration. As shown here, a basic site survey is useful to determine the general noise level in a lab and verify that the product being purchased will provide the required vibration reduction.
Warren Booth is the product manager of the Vibration Control Product Group at Newport, 1791 Deere Ave., Irvine, CA 92606; e-mail: [email protected]; www.newport.com.