COLORIMETRY: Color analysis meets the iPhone

Color reveals information about the absorbance and reflectance properties of a material, making color analysis a powerful tool for detecting a range of characteristics. Applications for color measurement technology are all around us—from paint matching systems at hardware stores to medical applications like gene sorting and finding cancerous cells. Miniature spectrometers perform color measurements quite well and are commonly used in research, food science, product development, and quality control for the process industry. Typically the small devices are connected to either a PC or a laptop through a USB interface and spectral data are collected at kilohertz rates, analyzed, and saved to a database.
Colorimetric specifications have evolved into international standards developed by the Commission Internationale de l'Eclairage (CIE). While CIE color parameters are useful for analyzing and quantifying specific narrowband light sources (like red, green, and blue LEDs) and colored reflective surfaces, a different set of parameters is used for broadband (white) light sources. One of the most common parameters is correlated color temperature (CCT). In this parameter, the spectrum of a light source is compared to a spectrum of a blackbody radiator at various temperatures in Kelvin. The spectrum of a blackbody moves to shorter wavelengths (bluish) when its temperature increases.
Determining the correlated color temperature of incandescent light sources is fairly simple as these spectra fit nicely on a blackbody radiator curve, but fluorescent and LED light sources have completely different spectral shapes compared to broadband incandescent sources, which makes it harder to perform an accurate fit. To address the effect artificial light sources such as fluorescent or sodium bulbs have on color perception, the CIE defined the color rendering index (CRI).1 To measure CRI, eight samples of varying hue are alternately lit with two illuminants, a reference and the light source under test, and the color appearance is then compared. The reference source, such as a blackbody radiator like a light bulb, is defined as having a CRI of 100, and the test source is compared against the reference with the same color temperature. Both sources are used to alternately illuminate several standard samples. The perceived colors under the reference and test illumination are compared using a standard formula, and averaged over the number of samples taken to get the final CRI. The color rendering index ranges from nearly zero for a quasi-monochromatic source like a low-pressure sodium vapor lamp to 100 for an incandescent light source like a light bulb.
The current CRI scale is problematic, particularly when applied as an indicator of color quality to white LEDs that have several peaks in the spectra. The CRI is based on only eight reflective samples, all of which have low to medium chromatic saturation. These samples do not adequately span the range of normal object colors. Some lights that are able to accurately render colors of low saturation perform poorly with highly saturated colors. Additionally, the CRI scale penalizes light sources for showing increases in object chromatic saturation compared to reference lights, a condition that could actually be desirable for most applications.
To solve the problems with CRI for solid-state light sources and to meet the new needs of the lighting industry and consumers for communicating color quality of all lighting products, a Color Quality Scale (CQS) is being developed at NIST (Gaithersburg, MD).2 The CQS evaluates several aspects of the quality of the color of objects illuminated by a light source—color rendering, chromatic discrimination, and observer preferences. The method for calculating the CQS is derived from modifications to the CIE method used to calculate CRI. The CQS method uses 15 saturated Munsell samples and a new computation scheme for determining the color rendering score that differentiates between hue and saturation shifts—and takes their directions into account.
The simplest color meters use diodes or pixels covered by red, green, and blue filters. More advanced systems use tristimulus filters. These types of systems work quite well for incandescent light sources but struggle to provide accurate answers for light sources such as LEDs. To detect small color changes, very high color resolution is necessary and most instruments then need to use a spectrometer. A spectrometer captures the light reflected, transmitted, or emitted by a sample and uses a dispersing element to split it into discrete wavelengths, capturing the spectral data for the sample under test. Because the instrument captures the complete spectral power distribution rather than merely measuring power in observer-specific wavelength bands, the resulting color measurement is more precise and robust. There has been much debate on how much wavelength resolution is needed to make an accurate color measurement, with competing standards from CIE or ASTM varying from 1 to 20 nm resolutions.
For years the most portable color measurement systems utilized a small, compact microspectrometer such as the Ocean Optics USB2000+. Thousands of these systems have been deployed for testing and binning of LEDs inside high-volume testing machines. Light-emitting diode manufacturers need to test the emission wavelength of each device to ensure the output is within ±0.5 nm of the specified emission wavelength. Microspectrometers can not only provide quantitative data, they can assess other metrics like brightness and output power for efficiency calculations. In most cases, it is more cost effective for a high volume LED user—such as an LED sign manufacturer—to test and sort a large number of LEDs into smaller bins than it is to tighten the specifications for the LEDs from the manufacturer. This would be impossible to do without the speed and accuracy of the color measurement from a microspectrometer (see Fig. 1).
Most handheld color meters deliver fewer than 20 wavelength bands, not enough for accurate or scientific studies. So what if you want to make a high-resolution color measurement but can't tolerate the size or weight of the laptop or even a netbook computer to make your measurement? The latest microspectrometer systems are specifically designed to allow portable measurements and can operate in the field. Our Jaz spectrometer, for instance, is a family of stackable, modular, and autonomous components that share a common electronics and communications infrastructure. Its two key elements are the crossed Czerny Turner CCD 2048-pixel array spectrometer that can be optimized for a variety of radiometric measurements and a microprocessor with on-board display.
A recent addition to the Jaz product line is the Universal Light Meter, which includes a spectrometer with 1.0 nm FWHM resolution, an 8 hour battery and power over Ethernet and USB connections, as well as a built-in microprocessor, user interface, and display. The unit is spectrally and radiometrically calibrated pixel by pixel and allows for an accurate analysis of a broad range of illumination sources. The instrument also provides an irradiance spectrum and additional calculated colorimetric parameters in the field. The output can also be viewed as photometric values, such as lux, lumens, or colorimetric values including x, y, correlated color temperature, and the color rendering indices.
Applications
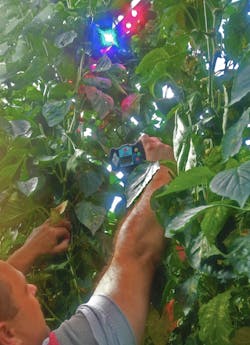
The Universal Light Meter is being deployed in a wide range of illumination applications. In the Netherlands, greenhouse growers are interested in the effects of light on the growth of their crops—there has been much debate about how the intensity of blue and/or red light affects both the growth rate and blossoming of various floral crops. Until now farmers and horticulturists were limited in their options to control and measure the illumination of their crops. But recently the horticultural industry has been experimenting with the addition of red, blue, and white LEDs to existing illumination systems. The idea is to better tune the spectral content to match the needs of the crops. Continuously monitoring the LED emission spectrum enables growth patterns to be correlated with the illumination spectra (see Fig. 2).
And, of course, it is important to measure photometric parameters locally for applications such as street lighting, advertising signs, and hospitality lighting; many particular instances of these applications are where the CRI is currently used, and where the CQS will come into play. The Jaz Universal Light Meter can be easily reconfigured for different spectral range and resolution requirements in such applications.
As color measurement needs evolve, especially for solid-state lighting, miniature spectrometer technologies and solutions will continue to adapt and provide accurate, flexible, and cost-effective solutions to a host of applications. Capturing and reporting of the spectral data is evolving as well. Color and measurement values are now available wirelessly on the iPhone, for instance, or can be transmitted over the Internet to a private network. The possibilities are as vast as the colors of the rainbow.
REFERENCES
- Commission Internationale de l'Eclairage, Method of Measuring and Specifying Colour Rendering Properties of Light Sources, CIE 13.3-1995.
- "Toward an improved color rendering metric," W. Davis and Y. Ohno, in Fifth International Conference on Solid State Lighting, Proc. SPIE 5941, 59411G (2005). See also http://physics.nist.gov/Divisions/Div844/facilities/photo/Publications.html.
About the Author
Dennis Schulmerich
Dennis Schulmerich is senior product marketing manager at Ocean Optics (Orlando, FL).
Marco Snikkers
Marco Snikkers is business development manager at Ocean Optics (Duiven, Netherlands).

Jason Eichenholz
Jason Eichenholz is the cofounder and CEO of Relativity Networks and a pioneer of laser- and optics-enabled innovation, product development, and commercialization. He holds a Ph.D. in optical sciences and engineering, as well as more than 90 patents within the field. Eichenholz co-founded Luminar, a leading provider of LiDAR. In 2023, he co-founded Relativity Networks.