BEAM CHARACTERIZATION: Beam profiling rises to the challenge of increasingly sophisticated laser systems
ROGER RYPMA
Measurement and analysis of laser-beam characteristics is essential for today's laser-based applications. In general, beam characterization involves measurement of the beam spatial-energy density distribution, commonly known as the beam profile. Beam-profile analysis provides an understanding of the beam spatial characteristics such as size, shape, position, propagation, and mode structure properties. These measurements enable the required process-specific beam parameters, such as alignment, focus spot size, or beam uniformity (to name a few), to be achieved and maintained for optimum laser system performance. Here, we discuss the fundamental concepts and techniques for measurement and analysis of laser beam profile characteristics.
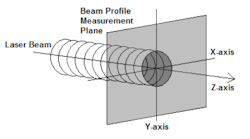
For lasers with beams that are nearly collimated (paraxial), measurement of the beam-profile characteristics involves sampling the spatial distribution of the beam energy (or power) density in a plane (x- and y-axis) perpendicular to the beam propagation path (z-axis; see Fig. 1).
The location of the measurement plane relative to the laser source along the z-axis is important to the type of beam-profile measurements being made and the information that can be derived about the beam properties. Near the laser, known as the optical near-field, the beam is dominated by a disordered wavefront and the beam profile can change as it propagates along the z-axis, so many beam characteristics are not constant. Typical near-field beam measurements can include size, shape, and mode structure details such as uniformity and peak intensity.
As the beam propagates away from the laser, the wavefront becomes ordered. In this region, known as the optical far-field, the beam-profile characteristics become stable and beam characteristics like divergence are constant. The distance from the laser source to the far-field is dependant on the laser type and complexity of the mode structure. However, a simplified estimate of the distance to the far-field (Zf) can be made using the approximation, Zf ≈ d2/λ, where d is the beam width (or diameter) at the laser output and λ is the wavelength. For a typical HeNe laser with a 1 mm beam diameter, the far-field is about 1.6 m from the laser; for a multimode Nd:YAG laser with a 6 mm beam diameter, the near-field may extend for 30 m or more depending on the complexity of the mode structure.
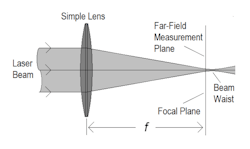
These large distances make access to the far-field measurement plane problematic, if not impractical, given the typical space limitations in a laboratory or a laser processing facility. However, several optical techniques can transform the beam into the far-field in a much shorter distance. The most common approach is the use of a laser-grade, diffraction-limited focusing lens or mirror to create the far-field at the optical focal plane (see Fig. 2). The far-field beam-profile measurement plane is therefore collocated at the focal plane of the optic, not at the beam waist. With this approach, for example, the beam divergence (θ) can be determined by measuring the transformed beam size (df ) at the focal plane and dividing by the focal length of the optic (f), where , θ = df /f. This technique is, however, typically limited to beams with less than 10 mrad divergence.Some beam-profile characteristics, such as the propagation parameter M2 or the beam-parameter product, require measurement in both the near-field, for the minimum beam waist size (do), and the far-field, for divergence (θ), where M2 = π doθ/4λ. The same optical technique as described previously can be used, but in this case, multiple beam-size measurements are made along the length of the focused beam waist. The measured beam sizes are then analyzed to determine the transformed minimum beam waist size and divergence.
Evolution of profiling
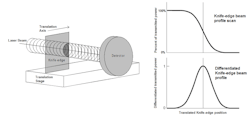
Beam sampling techniques have evolved based on the use of various physical apertures—such as knife-edges, slits, or circular apertures—that are scanned though the x-y measurement plane. A calorimeter or radiometer behind the aperture measures the beam power as the aperture is translated (scanned) through the beam. A knife-edge beam profile, produced by plotting the measured beam power vs. translation position and by differentiating the power measurements, results in a more familiar beam-profile plot (see Fig. 3). Scanning a slit aperture produces a similar profile plot without the need to differentiate the power measurements.Analysis of the beam-profile data then provides quantitative beam size and position information along the scan axis. Information on the overall beam mode structure can also be assessed. However, because the profile measurements represent the total accumulated energy or power across the beam along the axis of the slit or knife-edge, information on discrete localized energy-density information such as hot spots or mode structure details cannot be determined.
These aperture-scanning techniques can provide very high spatial resolution, depending on the physical limits of the aperture and the accuracy/stability of the translation stages. They are therefore well suited for measurement of focused spots, laser diodes, and even fiber-optic outputs—but because the scanning process takes time, these techniques cannot provide instantaneous beam profile information. Hence, short-term variations in the beam characteristics, such as for a pulsed laser, cannot be measured.
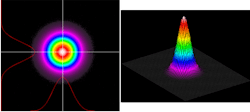
The advent of two-dimensional detector arrays and solid-state cameras offered a viable approach for measurement of short-term beam-profile variations. The individual sensors (pixels) in the detector arrays provide measurement of the energy density at discrete locations across the entire beam measurement plane while the entire array samples the beam simultaneously, thus providing a virtually instantaneous two-dimensional beam-profile data set (or beam image). This approach can therefore capture the beam characteristics of a single laser pulse. When coupled to a computer, the detector-array data can be digitized and graphically displayed for qualitative visual inspection of the beam mode profile structure using a variety of beam profile plots (see Fig. 4). Numerical analysis of the profile data provides beam size, shape, and position results.Like the previous beam-profiling techniques, the detector-array approach has its own set of difficulties and limitations. These include high sensitivity and low damage thresholds of the array sensors, requiring various optical approaches to attenuate the laser energy. Also, early detector arrays suffered from poor optical dynamic range, requiring careful treatment of both optical and electronic sources of background noise. Limited detector-array resolution and active area sometimes required optical manipulation (reimaging) of the laser beam to allow an optimum match of the beam size to the detector array.
State-of-the-art
Today, all these profiling techniques are used in various commercially available beam characterization instruments. The majority of these instruments take advantage of the processing, graphics, and data-handling capabilities of PCs to provide complete and accurate beam profile characterization.
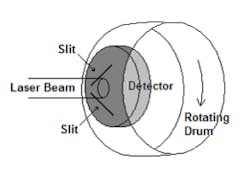
Slit- and knife-edge-based beam-profiling systems have been developed that utilize rotating drums or disks to translate multiple apertures through the beam measurement plane (see Fig. 5). Combined with high-speed detectors and digitization electronics, real-time beam profiles through multiple beam axes can be sampled, analyzed, and displayed with one scan rotation—an approach that enables pulsed lasers with repetition rates above 1 kHz to be measured, depending on the scan rotation rate, detector, and digitizer speed.Finally, the detector-array-based technique has become one of the most predominant types of beam-profiling systems, utilizing the latest advances in megapixel CCD and CMOS digital cameras, infrared-detector-array cameras, and a large variety of optical beam accessories. Software control of camera, data sampling, and image data processing functions ensure accurate results by correcting for any camera response or background noise effects that may be present in the profile data.
Measurements
The software for these beam-profile measurement systems has become very sophisticated, providing powerful graphical user interface controls, flexible qualitative beam-profile graphic displays, and a wide range of quantitative measurement results. Depending on the measurement technique being used, typical beam profile measurements provided by these systems include:
- Position: peak position, centroid position;
- Relative total energy or power;
- Peak power or energy density;
- Width and diameter: knife-edge, slit, D86, second moment (D4σ), cross-section widths, fitted widths and more;
- Shape: circularity/ellipticity, aspect ratio, beam orientation;
- Divergence: (requires far-field optical set-up);
- Propagation: M2, beam parameter product (requires multiple profile measurements through beam waist);
- Mode structure analysis: Gaussian fits, top-hat fits, uniformity, satellite or stray beams and more;
- Stability analysis: beam wander/jitter, mode hopping, drop-outs, warm-up, and more;
- Wavefront analysis (with a Shack-Hartmann camera).
The International Organization for Standardization (ISO) has been active in development of standard definitions and measurement processes for many of these beam characteristics (see "ISO beam profile related laser measurement standards" below).
Roger Rypma is a laser measurement applications consultant at Concise Dynamics, 23090 Hidden Ranch Road, Auburn, CA 95602; e-mail: [email protected].
