FEMTOSECOND-PULSE CHARACTERIZATION: Novel 2DSI method measures sub-two-cycle laser pulses

JONATHAN R. BIRGE and FRANZ X. KÄRTNER
In the four decades since the first demonstration of laser modelocking, short-pulse laser technology has steadily progressed from nanosecond pulses to the point at which near-IR pulses shorter than 5 fs (less than two optical cycles) are regularly produced directly from tabletop lasers. Such precise creation of coherent light over more than 200 THz of bandwidth has opened up new areas of applied and fundamental physical research: pulses at this timescale allow for the probing of physical phenomena on a femtosecond timescale, sufficient to resolve electronic relaxation processes in molecules or bonding dynamics, and have coherent bandwidths sufficient to control molecular quantum states to guide reactions.
Still, work continues toward the ultimate goal of a laser producing stable single-cycle pulses. As optical pulses approach these ultimate limits, however, the task of accurately measuring the pulses becomes one of the primary difficulties. The two dominant methods of ultrashort-pulse characterization, frequency-resolved optical gating (FROG) and spectral shearing (for example, spectral phase interferometry for direct electric-field reconstruction, or SPIDER), each has its own systematic issues that crop up as relative bandwidths approach unity.1, 2 In the case of self-referenced FROG, the relative bandwidths that can be measured are limited by bandwidth effects in optical harmonic generation, and the dispersion introduced by splitting the pulse being measured. For SPIDER, there is also the difficulty of pulse splitting, which raises a calibration and stability issue associated with its use of a sensitive delay between the split-pulse copies.3
To address these issues, we recently developed a variation of spectral shearing optimized for few-cycle pulses that avoids the need to split the pulse being measured, as well as the need for a delay calibration. Called two-dimensional spectral shearing interferometry (2DSI), its raw output provides an intuitive picture of the pulse phase: it is simply a trace of the spectral group delay, allowing the user to qualitatively gauge the phase properties of the pulse without need for reconstruction.4 The precise quantitative phase can be recovered to high precision, even in the presence of signal-to-noise ratios approaching one, by the use of a straightforward and direct algorithm that scales linearly with the number of spectral points.
Principle of 2DSI
Spectral shearing interferometry (pioneered by Iaconis and Walmsley in the SPIDER method) is unique among pulse-measurement techniques in that it unambiguously measures the spectral phase of an optical signal by directly interfering with neighboring frequency components. Our approach to spectral shearing is to mix the pulse under test in a nonlinear crystal with two collinear continuous-wave (CW) beams of slightly different frequency. The arrangement eliminates the potential for a delay to occur between the two output components—one of the largest potential issues with any spectral shearing method—so that the output is a single pulse whose spectrum is composed of two spectrally sheared copies of the original.
First, a highly chirped pulse is created by picking off a portion of the pulse to be measured, and dispersing it (see Fig. 1). This chirped pulse is sent through an interferometer (beamsplitter C) to create two copies of the chirped pulse, one delayed slightly with respect to the other. Because frequency changes with time in a chirped pulse, this effectively creates two CW beams with slightly different frequencies. These two “quasi” CW beams are then mixed with the original short pulse in a Type-II nonlinear crystal in a crossing geometry such that the sum-frequency-generation (SFG) signal can be isolated. This geometry provides extremely large phase-matching bandwidths, exceeding an octave.
To observe the phase difference between the two shifted spectral components at a given wavelength (which provides an approximation of the group delay at that wavelength) the relative phase of one of the quasi-CW beams is scanned over a few optical cycles. The phase scan is typically done by vibrating one of the mirrors in the Michelson interferometer (mirror A in Fig. 1) using a piezoelectric device, though it could also be achieved with a phase modulator, such as a liquid crystal or electro-optic device. The spectrum of the upconverted signal is then recorded as a function of the phase, yielding a 2-D intensity function with the axes being group delay and wavelength. A simple 2-D raster plot of the function reveals fringes shifted in proportion to the group delay at a given frequency, as we now illustrate.
Raw output shows salient features
In an example, the unprocessed 2DSI interferograms are taken from two measurements of a 5 fs pulse from a Ti:sapphire laser (see Fig. 2). The top figure is the 2DSI trace of the pulse directly from the laser, and the bottom trace is the same pulse after traveling through a glass plate. The user can thus immediately ascertain salient properties of the complex spectrum simply by looking at the raw data: the cosine fringe at each wavelength is vertically shifted in proportion to its actual delay in time, with the fringe amplitude roughly proportional to the power spectral density (neglecting bandwidth effects).
The 2DSI output provides a direct and intuitive picture of the precise timing of each spectral component of a broadband pulse, providing insight into the functioning of the laser without need for reconstruction. In Fig. 2, for example, not only is the overall dispersion of the pulse evident, but small oscillations can be seen indicating the presence of pre- and post-pulses caused by imperfections in the cavity mirrors. The steep roll-off that can be seen at low wavelengths is due to the limited bandwidth of the output coupler. The ability to use the raw spectrometer data when optimizing a laser yields information not available from processed data from an inversion algorithm alone, such as qualitative observation of laser stability and measurement noise.
A comparison of the group-delay curves in this measurement with theoretical predictions of the known dispersion of fused silica, demonstrates that 2DSI was able to correctly measure the phase delay caused by the glass plate to within an accuracy of tens of attoseconds over the entire 200 THz bandwidth.
Most recently, we performed a measurement on an octave-spanning sub-two-cycle pulse from an unamplified Ti:sapphire oscillator.5, 6 We showed the reconstructed pulse envelope and phase for a pulse measured to have a full-width at half-maximum of 4.9 fs (see Fig. 3). This is one of the shortest pulses ever measured with a self-referenced method directly from an oscillator (that is, without the use of an external amplifier). The measured interferometric autocorrelation (IAC) and that predicted by the 2DSI measurement showed close agreement. (We attribute the difference between the two to band-limiting effects on the IAC, which is not well-suited to measuring a 4.9 fs pulse.) This measurement was corroborated by detailed simulations of the laser cavity in question, which also predict a 4.9 fs pulse with a weak sub-pulse 9 fs away from the peak. This demonstrates that 2DSI is indeed a calibration-free implementation of spectral shearing.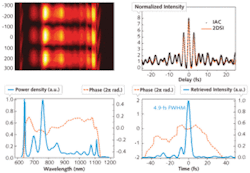
Future work
The geometry of 2DSI is unique in that the pulse to be measured never encounters a dispersive element, and yet the arrangement is still collinear. If the grating spectrometer were replaced by an imaging spectrometer, a spatially resolved 2DSI measurement could be taken along one axis. Moreover, if a full 2-D spatially resolved spectrum were available, such as that provided by an imaging Fourier-transform spectrometer, one could make a full 2DSI measurement at a 2-D array of points along both transverse axes. If the chirped beams were spatially filtered so that they were spatially coherent, they would provide a constant phase reference across the beam profile, enabling a full spatiotemporal reconstruction up to a trivial constant and quadratic spatial phase (that is, a degree of focusing). This would allow for the first self-referenced full 3-D measurement of a few-cycle pulse—work that is currently under way.
ACKNOWLEDGMENTS
The authors acknowledge funding from AFOSR, ONR, NSF, and DARPA, and would also like to thank Prof. Helder Crespo, who built the 4.9 fs laser.
REFERENCES
- D. Kane and R. Trebino, IEEE J. Quantum Electron. 29, p. 571 (1993).
- C. Iaconis and I. Walmsley, IEEE J. Quantum Electron. 35, p. 501 (1999).
- J.R. Birge and F. X.Kärtner, J. Opt. Soc. Am. B 25, p. A111 (2008).
- J.R. Birge et al., Opt. Lett. 31, p. 2063 (2006).
- H M. Crespo et al., Opt. Lett. 33, p. 833 (2008).
- J.R. Birge et al., CLEO/QELS Conf. and Photonic Applic. Systems Tech., OSA Technical Digest (OSA, 2008), paper CTuC3.
Franz X. Kärtner is a professor in the Electrical Engineering and Computer Science Department and the Research Laboratory for Electronics at Massachusetts Institute of Technology, 77 Massachusetts Ave., Cambridge, MA 02139. Jonathan R. Birge is a Ph.D. student in Franz Kärtner’s group; e-mail: [email protected]; engineering.mit.edu.