DIGITAL IMAGING: New technique tests digital-camera sensitivity
A collaborative effort by researchers in several countries has resulted in a new optical method to measure the sensitivity and quantum efficiency of each pixel in color digital single-lens-reflex (DSLR) cameras.1 The technique could help in creating test certificates that could be provided by the manufacturer for digital cameras used in applications as diverse as astronomy, remote sensing, high-speed imaging, and industrial processing.
The researchers were from The University Centre in Svalbard (Longyearbyen, Norway), Energy Campus Nord (Hammerfest, Norway), The Norwegian Institute of Food, Fisheries and Aquaculture Research (Tromsø, Norway), the Polar Geophysical Institute, Murmansk Region (Apatity, Russia), the University of Alaska (Fairbanks, AK), and Lancaster University (Lancaster, England).
Integrating-sphere source
To improve upon the uniformity of the Lambertian screen formerly used as the imaging target for the camera, an integrating sphere was used in the experimental setup. The 6-in.-diameter sphere from Edmund Optics (Barrington, NJ) has a 1-in.-diameter input port and a 2.5-in.-diameter output port and its interior is coated with Spectralon for a diffuse reflectance factor of 0.98 throughout the visible spectrum. A transmitting diffuser (0.5 mm thick and made of Teflon opal) was also added to the output port of the integrating sphere for additional light diffusion.
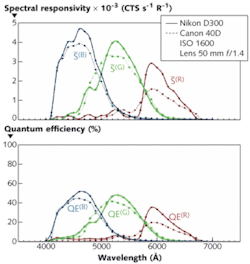
To complete the experimental setup, the output from a 150 W fiber illuminator fed into a monochromator enters the integrating sphere. The output from the sphere serves as the source for the DSLR under test. The absolute intensity of the sphere is measured by a calibrated spectrograph located off-axis from the camera. Both the Nikon D300 and Canon 40D cameras are operated in manual mode with sensitivity set at ISO 1600 and aperture at the maximum value of f/1.4 and exposure times of three to four seconds.
The monochromator is programmed to produce 31 intensity-calibrated spectral lines spaced roughly 10 nm apart across the 400-to-700 nm spectrum. For each pixel, average raw counts per second are read as a function of wavelength for each color channel of the cameras. From the raw data, singular-value-decomposition algorithms and calibration data from the spectrograph are used to compute the spectral responsivity and quantum efficiency for each color channel of the cameras as a function of wavelength (see figure).
Camera discrepancies?
The analysis showed that while both cameras have peak sensitivity in the blue and minima in the red channels, the Nikon D300 shows the highest sensitivity. The D300’s blue, green, and red channels have integrated spectral responsivity approximately 17%, 9%, and 54%, respectively, higher than the D40.
This surprising result prompted the researchers to double-check their experimental setup. After determining that the test conditions were indeed identical, an analysis of the lenses used for each of the cameras was undertaken to see what effect this may have had on the results. It turns out that the Nikon 50 mm f/1.4 AF-D and the Canon EF 50 mm f/1.4 USM lenses are almost identical with the same number of optical elements in the lens construction, and do not cause the color discrepancy noted. However, it turns out that the sensitivity discrepancy is probably due to variations in the color filters within the CMOS detectors. Nonetheless, the discrepancies observed as a result of applying the sensitivity test could be important tools to aid manufacturers in understanding and improving camera performance.
“The main challenge for this system was to make the output of the monochromator sufficiently uniform to be able to retrieve an average pixel response from the cameras,” said Fred Sigernes, head of the Kjell Henriksen Observatory at The University Centre in Svalbard. “We did this by using an integrating sphere and an opal diffuser. The advantage of the technique is that only one light source is used, and no prior information for each optical element is needed since a calibrated spectrograph obtains the throughput of the system. It is our wish that the manufacturers of DSLR cameras may provide us with this information in the future. It will open up a new dimension that will increase the usage and potential of these fantastic devices.”
REFERENCE
- F. Sigernes et al., Optics Express 17(22) p. 20211 (October 26, 2009).
About the Author

Gail Overton
Senior Editor (2004-2020)
Gail has more than 30 years of engineering, marketing, product management, and editorial experience in the photonics and optical communications industry. Before joining the staff at Laser Focus World in 2004, she held many product management and product marketing roles in the fiber-optics industry, most notably at Hughes (El Segundo, CA), GTE Labs (Waltham, MA), Corning (Corning, NY), Photon Kinetics (Beaverton, OR), and Newport Corporation (Irvine, CA). During her marketing career, Gail published articles in WDM Solutions and Sensors magazine and traveled internationally to conduct product and sales training. Gail received her BS degree in physics, with an emphasis in optics, from San Diego State University in San Diego, CA in May 1986.