SPECTROMETRY: High-sensitivity IR spectrometer has upconversion detector

It’s not every day that the performance of an optical instrument is boosted by a factor of a thousand. Researchers at the National Institute of Standards and Technology (NIST; Gaithersburg, MD) have achieved just this by creating a near-IR spectrometer that is at least three orders of magnitude more sensitive than conventional optical spectral analyzers.1
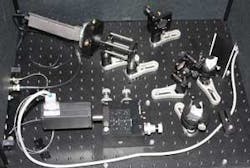
The new spectrometer is based on an earlier instrument developed at NIST: an upconversion 1330 nm detector in which a periodically poled lithium niobate (PPLN) nonlinear waveguide pumped with light at 1550 nm receives the weak signal light at 1330 nm, producing an upconverted output signal at 710 nm that can be detected with a silicon avalanche photodiode (Si APD), rather than the less-sensitive indium gallium arsenide detectors normally used to detect 1310 nm radiation.
However, the earlier instrument could only detect a single very narrow wavelength band (due to the quasi-phase-matching condition in the PPLN waveguide), and was thus not a spectrometer. The new NIST instrument replaces the fixed-wavelength 1550 nm pump source with a laser that’s tunable in a 70 nm range around 1550 nm, allowing quasi-phase-matching for any chosen signal wavelength within a certain wavelength range. When the pump-laser wavelength is scanned and the output recorded, the instrument becomes a spectrometer. (Other improvements to the new instrument include the use of a free-space instead of a fiber output, which increases overall transmission from 20% to 32%.)
Reducing noise
To achieve such a high sensitivity, the researchers took great care to reduce sources of noise. The light output from the pump source is amplified with an erbium-doped fiber amplifier; however, the pump light, although not far from 1550 nm, has a weak spectral tail that extends to 1330 nm—a potential noise source. Two 1310/1550 wavelength-division-multiplexer couplers, each with an extinction ratio of 25 dB, are used to reject light in the region of 1310 nm.
The pump and signal photons are combined in the PPLN waveguide, generating the 710 nm output signal; the resulting light is sent through a dispersive prism to separate the 710 nm signal from the 1550 nm pump light, which is then blocked. A second dispersive prism then separates the 710 nm signal from the waveguide’s undesired second-harmonic generation (SHG) at 775 nm; the SHG light is blocked by an adjustable iris. The light, which is linearly polarized, enters and exits the prisms close to the Brewster’s angle, ensuring low optical loss.
The resolution of the spectrometer is determined by the PPLN waveguide’s quasi-phase-matching acceptance bandwidth, which for the 50-mm-long waveguide grating is about 0.2 nm.
Sensitivity of -126 dBm
The spectrometer’s sensitivity is limited by the 32% detection efficiency, but also by the deviation of the detector’s dark counts. At a deviation of 50 counts per second (with shot-noise behavior) and a 10× margin of safety of 500 counts per second (equal to 1563 photons per second at 32% efficiency), the sensitivity is -126 dBm; this compares to a sensitivity for commercial optical spectral analyzers of usually about -80 to -90 dBm, says Lijun Ma, one of the NIST researchers.
“These commercial spectrometers use a dispersion element such as a prism or a grating or a tunable narrowband filter to separate light into its component wavelengths,” he says. (Note: this is different from the use of prisms in the NIST instrument simply to reject unwanted wavelengths.) “A detector is then used to detect the light that is separated at a particular wavelength. However, due to the loss at the dispersion element and the low detection efficiency of the detector in the near-IR range [of around 1330 nm], the sensitivity is limited.”
It is the elimination of dispersive elements or tunable narrowband filters, in combination with the use of a more-sensitive Si detector in the 710 nm region, that makes the NIST spectrometer so sensitive, says Ma.
The original motivation of the effort was to develop an ultrasensitive spectrometer for research into quantum information systems, notes Ma. “However,” he adds, “this technique could be used in any area that requires ultrasensitive spectrum measurement in the IR region, such as biomedical research, nanotechnology, chemistry research, and so on.”
REFERENCES
- L. Ma et al., Optics Express 17(16) p. 14395 (Aug. 3, 2009).
- H. Xu et al., Optics Express 15(12) p. 7247 (May 30, 2007).
About the Author
John Wallace
Senior Technical Editor (1998-2022)
John Wallace was with Laser Focus World for nearly 25 years, retiring in late June 2022. He obtained a bachelor's degree in mechanical engineering and physics at Rutgers University and a master's in optical engineering at the University of Rochester. Before becoming an editor, John worked as an engineer at RCA, Exxon, Eastman Kodak, and GCA Corporation.
