PRODUCT FOCUS: SPECTROMETERS: Shopping for a spectrometer starts with your application

Spectroscopy is as convenient and affordable as it’s ever been, and can be used anywhere across the full spectrum, from gamma rays to far-infrared. The Laser Focus World Buyers Guide lists 15 categories of spectrometers ranging from atomic-absorption to x-ray systems, all with the same general purpose—to measure the intensity or polarization state of light, or some other characteristic of the spectrum. Most of these spectrometer types are specific to a very narrow range of applications, such as fluorescence decay or atomic absorption. Spectrometers that measure wavelengths toward the center of the spectrum, from the ultraviolet (UV), through the visible (VIS), to the near infrared (NIR), are the most common and apply to the widest range of applications. We spoke to several providers of spectroscopy systems to ask them how to shop for a UV/VIS/NIR spectrometer.
The basic design of a UV/VIS/NIR spectrometer involves a light source illuminating an entrance slit, sent through a prism or diffraction grating, and focused by a lens through an exit slit to an eyepiece or detector. Sometimes reflected light is the object of study and thus is the source; often the light source is a laser or diode that illuminates a sample placed between the exit slit and the detector.
A series of tradeoffs
While certain criteria limit your choices—budget, optical resolution requirements, and wavelength—manufacturers agree that the most important question is what you’re trying to accomplish. Manufacturers may ask customers why they want to take a certain approach. “Once you start drilling down to the details, then you run into a series of design tradeoffs inherent to spectrometers. For example, if you want high resolution, you may have to sacrifice some spectral range,” says Rob Morris, director of marketing at Ocean Optics (Dunedin, FL).
Determine your wavelength range of interest and desired resolution to begin; this will narrow your choices of gratings and detectors. That isn’t as easy as it sounds for some applications. Gratings are typically specified by “blaze,” given in units of lines/millimeter (l/mm) or grooves/mm, which determines the resolution of your system. The higher the l/mm value, the better the resolution. In laser applications, you generally need to resolve close peaks, but in other applications, the peaks are broader, so you might only need to resolve, for example, blue from green. Each grating has an efficiency curve associated with it to help you match it to your wavelength range.
“To choose a grating, we ask what they’re measuring,” says John Monti, spectroscopy product manager at Shimadzu (Columbia, MD), “whether there are two or more bands of interest and how close together they are.” As a rule of thumb, says Monti, the resolution of the instrument is 1/10 of the band separation you require. If you have two wavelengths of interest 40 nm apart, you’ll need 4 nm resolution. For 0.1 nm (high) resolution, choose a grating with 1000 lines/mm; for the lowest resolution of 5 nm, a grating of several hundred l/mm will suffice.
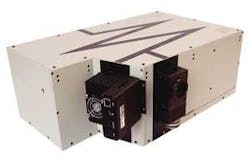
Types of gratings range from the least expensive glass or plastic (at the very low end), to ion-blazed (laser-etched) holographic gratings, to replicated ruled ratings, which are better quality gratings used in high-performance spectroscopy systems. If you have a wide range of wavelengths you want to look at, say, from UV to NIR, you may need a system with a few different gratings that you can switch between, which may increase cost. Many manufacturers offer gratings that cover from 200 to 1100 nm in two or three channels, which can be switched using the installed software (see Fig. 1). A filter wheel is often necessary to help cut out the higher-order light diffracted off the grating; a 250 nm grating can also return the undesired second-order diffraction at 500 nm and the third-order at 750 nm.
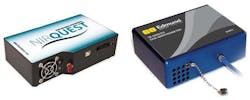
Which detector should you choose? Detectors for spectroscopy systems range from silicon (Si) single-element or array-based photodiodes, to germanium (Ge), indium gallium arsenide (InGaAs), and photomultipler tubes (PMTs). A Si photodiode is ideal for UV/VIS applications. For applications in the NIR, you might choose Ge or InGaAs, depending on the sensitivity (see Fig. 2, left). You might choose a PMT if you require single-photon detection. The cheapest detector, depending on the application, is a charge-coupled device (CCD) that covers a broad range of wavelengths, says Ed Manke, product manager at Newport’s Oriel product line (Stratford, CT); CCDs can cover the wavelengths handled by Si and Ge in one snapshot at the expense of resolution. “The more information you can give us, for example, the required sensitivity value as the number of photons you need to detect per unit area, the better,” says Manke.One rule of thumb for detectors is “spectral range of the system divided by number of elements in the detector = pixel resolution,” says Amr Khalil, product manager, Edmund Optics (Barrington, NJ). For example, a typical CCD array might have 2048 elements. “In our back-thinned spectrometer,” says Khalil, “the thinned CCD increases sensitivity in the blue and maximizes the spectral range of the same device from a total of 700 to 900 nm across. The tradeoff is that the pixel resolution changes from 0.34 to 0.44 nm/pixel, which may limit the resolution of the system.” To improve sensitivity, adding thermoelectric (TE) cooling capability to the CCD improves dark count and signal-to-noise ratio for low-light levels (see Fig. 2, right).
System resolution can also be specified in terms of wave numbers, such as in FTIR (Fourier-transform infrared) apps, says Shimadzu’s Monti. “Material scientists and physicists might need the resolution specified in terms of the energy associated with the wavelength, which would be in units of eV,” he says.
Trust your vendor
“Our role is consultative,” says Morris, “so the more we know about the why, the better we can configure a solution appropriate for the customer. Some customers get caught up in comparing specifications, which are only part of the story. The big picture involves overall system performance, the expectation of pre- and post-sale support, and the ability to pick the brain of someone with experience.”
Another choice is between an off-the-shelf model and a custom system. A commercial off-the-shelf system is not necessarily cheaper, as the cost is based on features you may not need. Vendors can tailor a solution for an application like a bull’s eye. “For example,” says Morris, “say a customer wants to measure a known pollutant in a retention pond in an environmental study of water-runoff reclamation. If the pollutant absorbs in the NIR, they’ll need an InGaAs or Ge detector. If it’s UV/VIS, they’ll need a CCD or photodiode. Whether they need to measure the concentration of the pollutant or just detect its presence determines the resolution required. Next, the choice of grating determines the optimal signal in the region of interest. And the desired resolution determines the slit size, which also depends on the image size and how much light is available.” A good manufacturer will take to heart what customers want to accomplish and try to mitigate the pain of the tradeoffs.
Next, do you need a high-performance, laboratory-grade benchtop model or a convenient, portable or handheld miniature one? As spectroscopy systems get smaller and more flexible, they generally decrease in cost. Miniature instruments now provide optical resolution that is high enough for the lion’s share of applications, according to Morris. Many miniature instruments can offer light sensitivity and optical resolution, signal-to-noise ratio, and stray-light values near that of lab-grade instruments. The types of systems that are available in a small form factor have expanded to include handheld Raman and portable mass spectrometers.
On the other hand, a larger optical bench will yield higher optical resolution performance than a smaller bench, simply because of a longer total optical path length (f-number). Some manufacturers specify this total path length in terms of 1/4 or 1/8 m. A high-resolution system would incorporate the longer-path 1/4 m spectrometer paired with a holographic grating with 2400 l/mm. “Some customers put two 1/4 m ones together to get higher resolution (on the order of 0.5 nm) and throughput, depending on the grating. The components (mirrors or gratings) for a longer path length are more efficient, and allow higher throughput, but increase the cost,” says Manke. Other manufacturers specify path length through the sample cell only, in units of centimeters, from 1 to 10 cm. European models use f-number values of 150 and 300 mm, the counterpart to 1/8 and 1/4 m.
Other challenges to communicate to your vendor are order sorting, aberration elimination, and stray-light control. On occasion, scanning speed is an issue. Dynamic applications like fluorescence lifetimes or mapping might require high scanning speed in space or time, says Domenic Assalone, general manager at Newport’s Oriel product line (Stratford, CT). “If you need to know how long you have to observe a kinetic or chemical reaction, anything that occurs in a finite time, you might be concerned with scanning speed.”Software features including control, calculation, manipulation, and storage of data may be crucial to consider. Researchers typically write their own routines in the existing software package to meet their needs, such as the handling of large data sets. But many spectrometers already have application-specific software available. In the photovoltaic market, for example, spectrometer software might automatically calculate the quantum efficiency as a function of wavelength (see Fig. 3).
Editor’s note: The “Product Focus” series is intended to provide a broad overview of the product types discussed. Laser Focus World does not endorse or recommend any of the products mentioned in this article.
About the Author
Valerie Coffey-Rosich
Contributing Editor
Valerie Coffey-Rosich is a freelance science and technology writer and editor and a contributing editor for Laser Focus World; she previously served as an Associate Technical Editor (2000-2003) and a Senior Technical Editor (2007-2008) for Laser Focus World.
Valerie holds a BS in physics from the University of Nevada, Reno, and an MA in astronomy from Boston University. She specializes in editing and writing about optics, photonics, astronomy, and physics in academic, reference, and business-to-business publications. In addition to Laser Focus World, her work has appeared online and in print for clients such as the American Institute of Physics, American Heritage Dictionary, BioPhotonics, Encyclopedia Britannica, EuroPhotonics, the Optical Society of America, Photonics Focus, Photonics Spectra, Sky & Telescope, and many others. She is based in Palm Springs, California.


