NANO ANALYSIS: Nanoparticle tracking system analyzes polydispersed samples
BOB CARR
The analysis of nanoparticles is increasingly important in a range of industry sectors. The performance and stability of manufactured products frequently depends on the ability to produce particle suspensions to fine tolerances without the presence of contaminants or aggregates. Similarly, the construction of complex, multilayer nanoparticles (for instance for drug delivery or speciality coatings) requires understanding of particle size and composition at all stages of manufacture. And, information regarding the environmental release and toxicity of engineered nanoparticles is an area of widespread and growing concern.
Foremost in such analyses is particle size and size distribution measurements. Several techniques are well established and commonly used in routine quality control and R&D applications (see “New system complements other options,” p. 85). But they aren’t up to the demands of polydispersed samples—that is, samples including particles of multiple sizes and shapes—which are ordinarily troublesome because of light scattering.
Nanoparticle characterization, with NanoSight’s nanoparticle tracking analysis (NTA) technology, is robust and relatively inexpensive. The NTA technique represents an attractive alternative or complement to higher-cost and more-complex methods such as dynamic light scattering (DLS), photon correlation spectroscopy (PCS), or electron microscopy. Its ability to resolve polydispersed particle distribution profiles far exceeds that of PCS, and it enables a simple and direct qualitative view of the sample under analysis. This enables not only validation of data obtained by other means, but also immediate generation of an independent quantitative estimate of sample size, size distribution, and concentration.
A light-scattering analysis method, NTA is being increasingly used to determine nanoparticle size by simultaneously tracking and analyzing the trajectories of individual nanoparticles undergoing Brownian motion in a fluid.
How it works
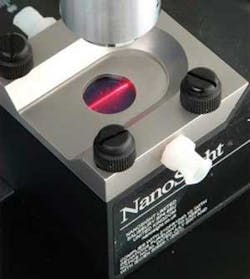
The sample analysis module on NanoSight’s Lm20 instrument comprises a small metal housing containing a solid-state, single-mode laser diode (less than 35 mW, 638 nm) configured to launch a finely focused beam through the sample of liquid containing a dilute suspension of nanoparticles placed directly above a specially designed optical flat. The sample chamber is approximately 250 µl in volume and 500 µm deep. Samples are introduced by syringe via a Luer port and allowed to thermally equilibrate for 20 seconds prior to analysis (see Fig. 1).
The beam refracts at the interface between the liquid sample and the optical element through which it passes, describing a path nearly parallel to the glass-sample interface. Particles in the beam (which is approximately 100 µm wide by 15 µm deep) can be seen through a conventional optical microscope aligned normally to the beam axis to collect light scattered from each particle in the field of view.
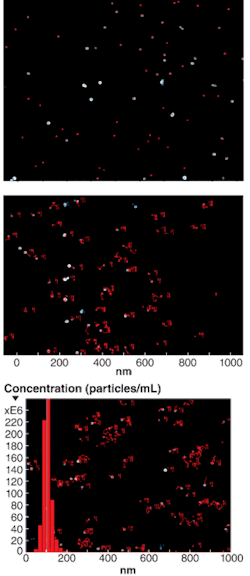
The system’s total magnification is quite modest: 100× via a microscope objective of 20× at a 0.4 NA working distance. The particles are seen down the microscope as small points of light moving rapidly under Brownian motion (see Fig. 2, top). The system records a 20- to 60-second video clip of the moving particles at 30 frames/s, which it analyzes using proprietary software on a frame-by-frame basis; each particle is identified and located automatically, and its movement is tracked (see Fig 2, center). The results of the analysis are displayed as a particle size distribution plot (see Fig. 2, bottom).To enable reproducible and accurate nanoparticle measurement, the system automates a number of functions, including optimization of camera settings, rejection of particle tracks that cross, adjustment of optimum track length selection, reduction of image noise, and correction of sample drift.
Results demonstration
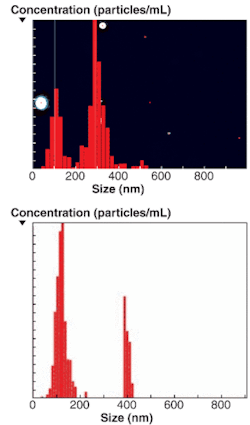
Results obtained from industry-standard polystyrene (PS) microsphere calibration particles and mixtures demonstrate the validity of the technique. It has been shown to work effectively with a variety of sample types, resolving different particle sizes within a mixture. Not only can real and accurate particle size distribution profiles be obtained from mixtures of different particle sizes, but concentrations of any given particle size population can be recovered (see Fig. 3).The NTA-estimated particle size reliably matches actual size for a range of sizes of calibration-standard particle suspensions. Even applied to monodispersed samples with larger particle sizes (approaching 1 µm) where Brownian motion becomes limited, particle size estimation remains reliable.
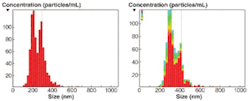
NTA can resolve bimodal mixtures as close in size as a ratio of 1.33—that is, samples in which one group of particles is just 33% larger than the other (see Fig. 4). This represents a significant improvement on alternative techniques such as DLS in which resolutions of size ratios of less than 3 (300% difference) are rarely achievable.Because NTA can see particles directly and individually, it is possible to estimate particle concentration. Knowing the scattering volume, the number of particles seen at any given instant can be simply extrapolated to a particle concentration per unit volume. This is a significant advantage over dynamic light scattering (DLS), in which particle number and concentration is unobtainable.
The technique has proved successful in measuring such samples as pigments in inks and paints (such as titanium dioxide), ferritin molecules, metal oxides (in magnetic storage media), precursor chemicals for wafer fabrication, multiwalled carbon nanotubes, fuel additives (such as zinc peroxide), cosmetics and health-care products (cream and shampoo formulations), foodstuffs (microemulsions), ceramics, quantum dots, polymers, and colloids of many different types. Many of these materials have been suspended in nonaqueous solvents such as toluene and heptane. Most recently NTA has been successfully used to characterize nanoemulsions, drug-delivery particles, the formation of nanoparticles using laser ablation techniques, and nanoparticles in toxicity studies. It requires minimal user involvement—simple input of sample temperature and solvent viscosity. Multi-angle measurements are unnecessary.
As a complement to PCS, NTA enables not only an information-rich view of particles in motion, but also allows for significant cost savings, particle-by-particle size analysis, better identification and resolution of polydispersed systems, and no need for either refractive-index data or disposables.
BOB CARR is founder and CTO of NanoSight, 2 Centre One, Lysander Way, Old Sarum Park, Salisbury, Wiltshire, SP4 6BU, UK; e-mail: [email protected]; www.nanosightuk.co.uk.
New system complements other options
Depending on the nature of the product and the particle characteristics involved, scientists and engineers routinely use one or more methods to analyze samples. The options include electron microscopy, dynamic light scattering, Fraunhofer scattering, single-particle-detection techniques, and optical microscopy.
For particles at the nanoscale, only the first two of these options are typically viable. But both have significant drawbacks. For electron microscopy these include capital and running costs, lengthy analysis turnaround time, and uncertainty as to whether the images of the lyophilised and coated surface bound structures reflect those in the native state.
While dynamic light scattering (DLS) methods—exemplified by photon correlation spectroscopy—are industry-standard methodologies and are used routinely and very successfully for the analysis of monodispersed and homogenous sample types, DLS methods can become unreliable when presented with heterogeneous samples that contain a wide range of particle sizes (that is, are polydisperse), and that the basic information obtained, the intensity weighted, mean size (the “z-average”) and a polydispersity quotient indicating the width of the particle size distribution, does not always reflect the sample composition accurately.
Furthermore, successful analysis of the correlation function by classical deconvolution algorithms to extract, for instance, multimodal distributions are realistically limited to sample types containing only two (or exceptionally three) monodispersed particle sizes, each needing to differ from each other by a size factor of, in practice, more than 3:1. DLS is also limited in its ability to allow the user to recognize when the sample is unsuitable for analysis by that method and that the data (the particle size distribution profile) obtained should accordingly be treated with some suspicion.
Nanoparticle characterization is a new technique that provides an attractive alternative or complement to higher cost and more complex methods.


