ULTRAFAST-PULSE MEASUREMENT: Wanted: simple methods for complex measurements

PAMELA BOWLAN, PABLO GABOLDE, AND RICK TREBINO
It has become possible to measure the temporal intensity and phase of a wide range of ultrashort laser pulses, whether a few-cycle infrared pulse or an oddly shaped ultraviolet pulse. But today’s fundamental studies and emerging applications often involve much more interesting pulses, like continua generated in air or light scattered from a living cell-pulses whose measurement in time and space will lead to new technologies or teach us important principles about life, not just us how well our laser is aligned.
New devices will have to measure not merely laser pulses, which are relatively simple in space and time and are fairly intense, but, more generally, light pulses, which are not so simple in space and time and often are not all that intense. Furthermore, these devices also must not be so complex as to introduce the very distortions they hope to measure. In short, the goal is not to create complex devices that can measure only simple laser pulses, but simple devices that can measure complex light pulses-in time and space.
It is also important to realize that measuring a pulse in time and space involves much more than just measuring separate temporal and spatial intensity-and-phase profiles. Complex pulses nearly always involve distortions in time that vary significantly from point to point in space, which cannot be accounted for with separate temporal and spatial profiles. Simple examples of these spatio-temporal distortions include pulse-front tilt, spatial dispersion, and angular dispersion. Much more complex spatio-temporal effects abound, especially if high-intensity nonlinear-optical effects are present or if a pulse is focused, when well-known aberrations can occur in conjunction with purely temporal distortions, like group-velocity dispersion. Simulations of such effects predict some very complicated and weird-looking fields in space and time that require complete spatio-temporal characterization.
Fortunately, two new devices have emerged this year that allow the complete spatio-temporal measurement of the electric field, E(x, y, z, t), of even complex light pulses. Both devices involve interfering the unknown pulse with a spatially smooth (but possibly temporally complex) reference pulse, usually obtained by spatially filtering a replica of the unknown pulse-and measuring it in time with frequency-resolved optical gating (FROG) or GRENOUILLE (a simple version of FROG-see www.laserfocusworld.com/articles/259917).1 In both cases the unknown pulse information is retrieved from the cross term in the measured spectrum or spatial profile of the sum of the two pulse electric fields.
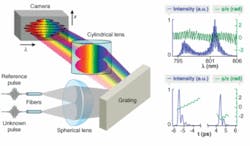
The first device, which goes by the name SEA TADPOLE, involves simply measuring the spectrum of the sum of the unknown and reference pulses, a type of spectral interferometry.2 Unlike conventional spectral interferometry, which uses collinear beams, it involves crossing the beams at an angle in space, hence its name: SEA TADPOLE (spatial encoded arrangement for temporal analysis by dispersing a pair of light E-fields; see Fig. 1). SEA TADPOLE can measure even a focused pulse.
The second device is named STRIPED FISH, which stands for “spatially and temporally resolved intensity and phase evaluation device: full information from a single hologram.”4, 5 As its name implies, it is based on holography and involves simultaneously measuring many holograms, one for each frequency in the pulse. STRIPED FISH can measure a single (but unfocused) pulse.
Both devices involve simple and nearly alignment-free apparatus and have pulse-retrieval algorithms that are quick, direct, and reliable.
SEA TADPOLE
Spectral interferometry can completely characterize an unknown pulse in time. It is also very sensitive and can even measure trains of pulses with less than a single photon per pulse.3 And it is straightforward in principle. Unfortunately, in practice, previous implementations have had serious limitations. Spectral resolution was limited because the unknown and reference pulses had to be separated in time to yield difficult-to-resolve spectral fringes necessary for the mathematical retrieval process. Also, spectral interferometry has a rather unwieldy experimental setup, comprising an alignment-sensitive interferometer, variable-delay line, and a spectrometer that the two pulses must enter perfectly collinearly and with precisely the same spatial modes.
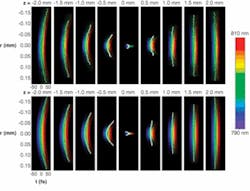
SEA TADPOLE offers all of the advantages of spectral interferometry, but none of the disadvantages.6 Its crossed beams avoid the need for difficult-to-align collinear beams and yield a measured two-dimensional (2-D) trace with spatial, not spectral, fringes, thus avoiding the reduced spectral resolution. Indeed, it turns out that SEA TADPOLE actually achieves better spectral resolution than that of its spectrometer because it measures the potentially negative or complex field, rather than an always positive spectral intensity. As a result, it can measure very complex pulses. In addition, the input fibers ensure perfect spatial modes and perfect mode-matching. Finally, the fiber samples a tiny region of a usually larger beam, so scanning it in space yields the complete spatio-temporal measurement of a pulse, even at or near a focus-a feat that it recently accomplished for the first time (see Fig. 2).
null
STRIPED FISH
Due to the scanning required, using SEA TADPOLE for spatio-temporal measurements is inherently multishot. But what if your repetition rate is only one pulse per day, and you need a single-shot method? If SEA TADPOLE’s trick was to expand a one-dimensional measurement to two, how will we now cram four dimensions of information into a single 2-D camera frame? The solution is STRIPED FISH.
How does STRIPED FISH work? First, it is really only necessary to measure three dimensions, E(x, y, t), because propagation integrals can yield the z-dependence if E(x, y, t) is known. Then, to measure E(x, y, t) or, equivalently, E(x, y, ω), STRIPED FISH reverses the order of SEA TADPOLE’s steps: it first spectrally resolves the beams, and then crosses the resulting beam pairs, recording multiple holograms simultaneously-one for each frequency in the pulse-in a larger camera frame. Each hologram contains the complete spatial intensity and phase for a single frequency ω0, that is, E(x, y, ω0). Given knowledge of the reference pulse, E(x, y, ω) can be reconstructed for all ω and then a Fourier transform provides E(x, y, t) for all t.
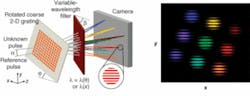
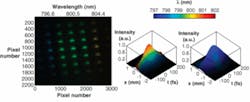
STRIPED FISH involves only two optical components (see Fig. 3). The reference and unknown pulses first pass through a low-dispersion 2-D diffraction grating that generates a 2-D array of replicas of them and hence an array of holograms, all with horizontal fringes, at the camera where the beams cross. A tilted bandpass filter spectrally filters the beam pairs into wavelengths that depend on the horizontal beam angle (or position). Finally, note that the 2-D diffraction grating is also rotated slightly about the optical axis, z, so the hologram array is also slightly rotated. As a result, the holograms involve pairs of beams at (uniformly spaced) different wavelengths. A single camera frame is all that is required to record all the holograms. Yet it can measure almost any pulse (see Fig. 4).
null
In STRIPED FISH, the maximum measurable time-bandwidth product (TBP) is roughly the number of holograms. Similarly, the maximum measurable space-bandwidth product (SBP) is roughly the number of pixels in each hologram. The maximum pulse complexity that STRIPED FISH can measure is then given by the space-time-bandwidth product, SBP × TBP, which is about 105 for a few-megapixel camera. SEA TADPOLE can measure even more-complex pulses, and its potential depends on the input-fiber core size, the xyz scan range, the spectrometer resolution and range, the stability of the pulse train to be measured, and how much time one has to make the measurement.
REFERENCES
1. R. Trebino, Frequency-Resolved Optical Gating: The Measurement of Ultrashort Laser Pulses (Kluwer Academic Publishers, Boston, 2002).
2. P. Bowlan et al, Opt. Expr. 14, 11892 (2006).
3. D.N. Fittinghoff et al., Optics Lett. 21, 884 (1996).
4. P. Gabolde, and R. Trebino, Opt. Expr. 14, 11460 (2006).
5. Z. Liu, et al, Opt. Lett. 27, 22 (2002).
6. A.P. Kovaecs, K. Osvay, Zs. Bor, Opt. Lett. 20, 788 (1995).
PAMELA BOWLAN and PABLO GABOLDE are graduate students and RICK TREBINO is the founder of Swamp Optics (Atlanta, GA) and Georgia Research Alliance-Eminent Scholar Chair of Ultrafast Optical Physics at the Georgia Institute of Technology, School of Physics, 837 State St. NW, Atlanta, GA 30332; e-mail: [email protected].