Hyperspectral Imaging: Producing a better pickle
One of the most popular vegetables in the American diet is the cucumber—at least if it’s a pickle. The prevalence of the pickle has spawned high standards among consumers, who want a product that is firm, has no internal cavities, and is consistent in quality. Most people, however, have had the experience of biting into a pickle only to find it either pulpy or oddly hollow.
How difficult is it to evaluate a pickling cucumber on an assembly line? Checking a cucumber for hollowness, for example, may seem to be straightforward, simply achieved by measuring the pickle’s density. In reality, however, this method results in a high rate of misclassification.
Light-based methods for detecting vegetable quality have been developed-for example, quantifying the delayed light emission (DLE; a result of photosynthesis) of a vegetable by placing it in the dark for an hour or more, then carefully measuring its DLE. While this method can distinguish between bruised and undamaged cucumbers, it does not lend itself to use on an assembly line. Alternatively, light can be shone through a cucumber to find voids, but the relatively low transmittance of cucumbers results in long integration times.
Researchers at Michigan State University have taken a third approach-hyperspectral imaging-and developed it into a fast and reliable method for checking the quality of pickling cucumbers. They have experimented with different wavelength ranges and image-processing algorithms in attempts to find the best performance approach.
Transmittance hyperspectral imager
One setup, a visible and near-IR transmittance hyperspectral imager covering the 450 to 1000 nm spectral region, included a high-performance back-illuminated CCD and control unit made by Hamamatsu (Hamamatsu City, Japan), a zoom lens, an imaging spectrograph from Spectral Imaging (Oulu, Finland), and a tungsten halogen fiberoptic light source from Fiberoptics Technology (Pomfret, CT).1
“Since light will go through the whole fruit, this system is especially useful for assessing internal quality and defects of cucumbers,” says Renfu Lu, one of the researchers. “We tried to detect damage to the cucumber carpel (seed cavity) caused by mechanical stress resulting from rolling under load or dropping, two common forms of load occurring during harvesting, transporting, and post-harvest handling. The forms of internal tissue damage include separation of carpels (hollow hearts) or bruises to the carpel.”
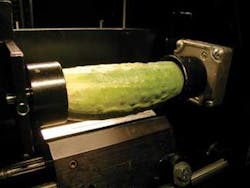
The researchers divided 90 defect-free cucumbers 37 to 55 mm in diameter into two experimental groups. The cucumbers in the first group were bruised by dropping them each six times onto a tiled floor from a 1 m height at random orientations; the “cukes” in the other group were each rolled for one minute between a benchtop and a board supporting a 10 kg mass (damage sometimes creates cavities as well as bruising). For measurement, each specimen was held at its ends by two cone-shaped holders that allowed stepper-motor-controlled rotation of the cucumber about its axis (see Fig. 1).
Each cucumber was subjected to three hyperspectral line scans 120° apart. A set of hyperspectral images was first taken of all specimens before mechanical stress was applied. After the cucumbers were either dropped or rolled, they were imaged again within two hours after their ordeal, then yet again one, two, three, and six days afterward. The size of the raw hyperspectral images was 256 × 256 pixels (with one axis showing spectral and the other spatial information); the camera, which was set to super-high-gain mode, performed 2 × 2 binning while imaging. A white Teflon cylinder was also imaged in the same manner to provide a control transmission measurement for correcting the hyperspectral data. In addition, the measured cuke diameters were taken into account to minimize the effect of diameter on the data.
Two classification algorithms were tested. In partial-least-squares discriminant analysis (PLS-DA), a multivariate projection of the hyperspectral data was performed to best separate classes of data; the so-called response variable was set to 0 for a normal cucumber and 1 for a defective cucumber. In the other approach, hyperspectral image thresholding, a chosen threshold resulted in a binary (no gray scale) image that highlighted defects; anything more than 15 defect pixels sent the cucumber into the realm of damaged goods. Both algorithms were run in Matlab (The Math Works; Natick, MA), along with a Matlab plug-in partial-least-squares program from Eigenvector Research (Wenatchee, WA).
Transmittance results
The mean spectra of the normal and damaged cucumbers revealed a large increase in transmittance in the 700 to 1000 nm region for the damaged specimens, although the spectral shapes were similar. The variance of the defective spectra, however, was large, showing overlapping with some of the spectra for the normal cucumbers—which would make a simple spectral sorting technique prone to high error. The spectra showed transmittance peaks around 740 and 800 nm, which are gaps between absorption peaks of chlorophyll and water.
The accuracy in classifying cucumbers based on PLS-DA was different for defective and normal specimens, with normal ranging from 88.2% to 98.0% accuracy at different measurement time spans, and defective ranging from 75.7% to 86.5% accuracy; with diameter correction, the accuracies improved a bit for both normal and defective. The researchers also used standard-deviation data to account for possible localized spikes in transmission along the scan line (indicating injuries in the carpel suture), but the analysis showed mixed results.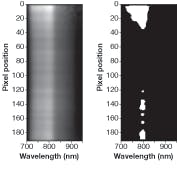
For the image-segmentation (thresholding) analysis, a spectral band centered around 800 nm was chosen. Hyperspectral images were processed to produce binary images with the threshold set at 0.5 (see Fig. 2). The accuracy of classification for this method was higher than that for PLS-DA-up to 91.9% for defective and 100% for normal cucumbers.
Reflectance hyperspectral imager
A second cucumber-classifying setup, which captured hyperspectral images in the 900 to 1700 nm range, operated in reflection.2 In this case, the camera, made by Sensors Unlimited, Goodrich (Princeton, NJ), had an indium gallium arsenide sensor with an array size of 320 × 240 pixels. Sample quantities and preparation were similar to those for the transmittance hyperspectral-imaging experiment, as was the use of a white Teflon cylinder as a control.
“Our previous research and others found that the near-IR region can be more effective than the visible region for detecting surface defects or defects under the peel such as bruises,” says Lu. “Light has poor penetration in the near-IR region beyond 1000 nm, and hence the transmittance mode is not feasible.”
To better test the bruise-detection algorithm, the researchers decided to first sort bruised from normal specimens ahead of the experiment, based mainly on near-IR images at 1200 nm, but also on visual identification (in some cases, bruises appear as darker waterlogged areas). The test regions of interest for both normal and bruised cucumbers were then manually selected from the near-IR images, ranging in size from 12 to 1343 pixels for bruised specimens and from 64 to 1566 pixels for normal specimens. An analysis of both categories-including a principal-component analysis-resulted in optimum thresholds for testing.
Reflectance results
The average reflectance of bruised areas was lower than that of normal areas over all but the 1400 to 1550 nm portion of the test spectral region; the difference was the highest in the 950 to 1350 nm region. This spectral difference decreased over time, however, with the differences sometimes disappearing after six days-showing the need for prompt testing (see Fig. 3).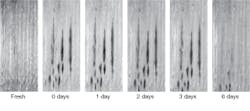
Using the first principal component (determined from the analysis), hyperspectral data were taken at zero, one, two, three, and six days after bruising, with data taken each day at spectral resolutions ranging from 4.4 to 35.2 nm. An 8.8 nm spectral resolution produced the most accurate results over the six-day period, so this value was used for further tests in three spectral bands: 950-1650, 950-1350, and 1150-1350 nm. Of these three spectral ranges, the highest classification accuracies were achieved for the 950-1350 nm range, reaching 94.6% for tests two hours after bruising and dropping to 74.6% by day six.
Classification by ratio and difference of two wavelengths was also carried out. The optimum wavelengths for ratio calculations were determined to be 988 and 1085 nm, while for difference calculations the best were 1346 and 1425 nm. While the experimental classification accuracies were substantially similar to those for the first-principal-component tests, the ratio and difference accuracies were higher at six days (81.8% and 83.6%), indicating a reduced sensitivity to time-based changes in the bruises.
Aiming for real-world use
The Michigan State researchers are aiming to produce a device suitable for use on a production line. “We recently built a laboratory-prototype hyperspectral-imaging system that allows us to inspect individual cucumbers in real time for both external and internal defects and quality,” says Lu. “We are testing and evaluating the prototype and developing improved algorithms for quality classification of cucumbers. Speed is very important for online applications, but we believe the hyperspectral-imaging prototype we built will be able to meet the online requirements.”
REFERENCES
1. D.P. Ariana and R. Lu, “Visible/Near-Infrared Hyperspectral Transmittance Imaging for Detection of Internal Mechanical Injury in Pickling Cucumbers,” presented at the 2006 American Society of Agricultural and Biological Engineers annual meeting, July 9-12, 2006.
2. D.P. Ariana et al., Computers and Electronics in Agriculture 53, 60 (2006) www.sciencedirect.com.
About the Author

John Wallace
Senior Technical Editor (1998-2022)
John Wallace was with Laser Focus World for nearly 25 years, retiring in late June 2022. He obtained a bachelor's degree in mechanical engineering and physics at Rutgers University and a master's in optical engineering at the University of Rochester. Before becoming an editor, John worked as an engineer at RCA, Exxon, Eastman Kodak, and GCA Corporation.