Imaging Spectrometers: Imaging spectrometers go commercial
JOHN KEREKES
Optical technology for the imaging of our world with a complete high-resolution spectrum in every pixel has been around for more than 20 years, enabling advances in environmental monitoring, defense and security, and even medical imaging. Across diverse applications and from the laboratory to spaceborne systems, imaging spectrometry advances continue in hardware and algorithm development. Despite these advances, however, widespread deployment of these systems is yet to materialize. Are the promised capabilities overhyped? Is data analysis too complicated? Is the technology not cost effective? Are the markets not developed? Although a “yes” answer in many cases challenges the future of imaging spectrometers, a number of companies are now offering complete systems for commercial airborne and laboratory applications.
Technology basics
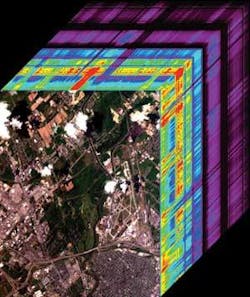
Imaging spectrometry can be defined as the acquisition and analysis of spatially coregistered images collected across portions of the optical spectrum in hundreds or thousands of narrow, contiguous spectral bands (see figure, above).1 The high-resolution nature of the spectral bands distinguishes imaging spectrometers from multispectral imagers, which typically have a few discrete, widely spaced spectral channels.
While the terms “imaging spectrometry” and “hyperspectral imaging” are often used interchangeably, one reasonable way to distinguish them is based on the phenomenology of the intended applications. Imaging spectrometry usually refers to the use of particular spectral absorption features in the scene to uniquely identify materials or their concentrations, while hyperspectral imaging usually refers to the use of spectral oversampling and the redundancy of high dimensionality to distinguish subtle differences between material classes. Of course, the same systems can be used in both applications and the distinction becomes academic.
Imaging spectrometers have two critical components that enable the collection of spectral images. First, a device is required to separate the wavelengths in the spectrum; second, a focal plane of detectors is necessary to sense the radiation.
Spectral separation can occur either in space or in time. Many imaging spectrometers have adopted a dispersive technique using either a prism or a diffraction grating to spread the spectrum across one dimension of a focal-plane array with the orthogonal direction sampling a spatial dimension. Either moving mirrors (scanning) or platform movement (pushbroom) then allows the formation of a two-dimensional (2-D) image. Temporal techniques can use a moving filter wheel or, more commonly, a tunable filter (acousto-optic or liquid crystal) in front of a framing array. These techniques offer an advantage of spatial integrity in that each spectral image is collected all at once, but have the disadvantage of potential spatial misregistration between images due to movement in the scene.
Interferometry techniques can be implemented either in time (Fourier transform) or in space (Sagnac), but suffer similar misregistration problems. In the past ten years, another temporal technique has been developed, called the chromotomographic approach.2 This technique uses rotating gratings or prisms to disperse projections of the spectral scene onto a 2-D focal plane, allowing fast and full hypercube collection and monitoring of time-resolved events.
Continued developments in focal-plane-array technology have provided more options to the designers of imaging spectrometers, although the dominant detector technology continues to be a silicon charge-coupled device (CCD) covering the visible through near-infrared spectral range (400 to 1000 nm). Mercury cadmium telluride (HgCdTe) and indium antimonide (InSb) arrays are used for longer-wavelength regions beyond 1000 nm, but recent advances have demonstrated operability of indium gallium arsenide (InGaAs) arrays spanning 400 to 1700 nm in a single array.3
Systems and applications
Much of the initial work in the development and use of imaging spectrometry began with the development of airborne Earth imaging systems in the 1980s. These systems built on the experience of the multispectral imaging systems working in the solar reflective spectrum (400 to 2500 nm) with high spatial (tens of meters) and spectral (λ/∆λ approximately 100) resolution.
Land remote-sensing. Achievements from developments in airborne hyperspectral imaging (HSI) led to the demonstration of HSI from space through the EO-1 Hyperion instrument from NASA. Launched in November 2000 as a technology demonstration mission, Hyperion continues to function well and may last until the satellite runs out of fuel in 2011. Collecting imagery with 30 m ground resolution in more than 200 contiguous narrow bands from 400 to 2500 nm, Hyperion’s signal-to-noise ratio is not as high as airborne sensors, but its data has been successfully used in a variety of science investigations, including geophysical events of interest (fires or volcanic eruptions).4
Higher-resolution (approximately 1 m) airborne hyperspectral instruments have become increasingly available and are used in urban environments for such applications as the identification and tracking of individual cars. The RIT Digital Imaging and Remote Sensing (DIRS) Laboratory has constructed the airborne hyperspectral imager MISI for use in such phenomenology and algorithm development experiments.5
Atmospheric sensing. Atmospheric sensing uses imaging spectrometers operating in the IR region (3 to 15 µm). These systems sacrifice spatial (2 to 20 km) for very fine spectral (λ/∆λ approximately 1000) resolution to sense the shape of individual gas absorption lines and retrieve vertical temperature profiles and concentrations of trace-gas species.
Successful demonstrations with the NPOESS Airborne Sounding Testbed-Interferometer (NAST-I) and the Atmospheric Infrared Sounder (AIRS) on the NASA Aqua satellite have paved the way for operational systems on polar orbiting and geostationary weather satellites including the Hyperspectral Environmental Suite (HES) planned for the GOES-R platform scheduled for launch in 2012.6, 7 In particular, AIRS with its nearly 2400 spectral channels spanning the midwave and longwave IR and nominal 15 km spatial resolution has demonstrated a positive impact on global weather forecasts through the ingestion of its measurements by forecast models. High-resolution thermal-IR imaging spectrometers operating from the air or ground can also detect and identify man-made gaseous effluents.8
Laboratory imaging. Laboratory applications depend on the combined spatial and spectral information offered by imaging spectrometers. In the biomedical field, imaging spectrometers are being explored for their potential to detect, for example, precancerous lesions by providing spatial maps of oxygenated hemoglobin, or to characterize wounds and monitor healing of skin.9 Another application is the imaging of fluorescent semiconductor quantum dots encapsulated in tumor-targeting molecules as they travel to cancerous areas in laboratory mice.10
Commercial systems
Today, numerous vendors offer airborne systems and aerial imaging services (see Table 1). The majority of these systems use the pushbroom imaging mode with a diffraction grating and are limited to the spectral response of silicon, although a few offer collection out to the shortwave IR. While many of these systems got their start in and continue to serve the defense and security community, they also serve growing markets in energy and mineral exploration.
| Company | Instrument | Characteristics | Comments | Contact Information |
|---|---|---|---|---|
| BAE Systems Advance Technologies Washington, DC USA | AURORA | 380-1030 nm, < 300 bands, grating pushbroom | Compact airborne imaging systems, analysis software | [email protected] |
| Flight Landata, Inc. Lawrence, MA USA | C2VIFIS | 420-870 nm, 96 bands, variable interference filter pushbroom | Compact airborne instruments and aerial imaging services | flightlandata.dyndns.org |
| Headwall Photonics, Fitchburg, MA USA | Micro-Hyperspec | 400-1000 nm, 170 bands, holographic diffraction grating pushbroom | Compact airborne systems suitable for unmanned vehicles | www.headwallphotonics.com |
| ITRES Calgary, Alberta Canada | CASI 550 SASI 600 | 450-1000 nm, 288 bands, 950-2450 nm, 100 bands, diffraction grating pushbroom | Airborne instruments and aerial imaging services | www.itres.com |
| Integrated Spectronics Baulkham Hills, NSW Australia | HyMap | 450-2500 nm, 126 bands, cross-track scan | Airborne instruments, aerial imaging services, analysis software | www.intspec.com |
| Spectral Imaging Oulu Finland | AISA Eagle AISA Hawk | 400-970 nm, 244 bands, 1000-2400 nm, 240 bands, diffraction grating pushbroom or scan mirror | Airborne and ground-based instruments | www.specim.fi |
| SpecTIR Sparks, NV USA | VNIR SWIR | 400-990 nm, 256 bands, 970-2450 nm, 254 bands, cross-track scan | Airborne instruments, aerial imaging and analysis services | www.spectir.com |
A market area with large-volume potential is the use of hyperspectral imaging systems in field, industrial, or laboratory settings. Several vendors are building systems suitable for these environments (see Table 2). The increased time available for image collection on the ground rather than in the air allows designs with a greater variety of spectral selection techniques and expanded spectral coverage. While the industrial inspection market offers one customer base for these systems, the biomedical imaging field offers the greatest market potential.
| Company | Instrument | Characteristics | Comments | Contact Information |
|---|---|---|---|---|
| Cambridge Research Instruments Woburn, MA USA | Nuance | 420-720 nm, < 40 bands, liquid crystal tunable filter staring system | Laboratory system with biomedical analysis software | www.cri-inc.com |
| CI Systems, Inc. Simi Valley, CA USA | SI-900 | 400-900 nm, > 140 bands, Sagnac interferometer pushbroom | Field- or lab-based systems; SWIR, MWIR, and LWIR systems also available | www.ci-systems.com |
| Geospatial Systems, Inc., Rochester, NY USA | V700 | 430-720 nm, 30 bands, liquid crystal tunable filter staring system | Industrial applications | www.geospatialsystems.com |
| Physical Sciences, Inc., Andover, MA USA | AIRIS | 3-5 µm, > 20 bands, 8-12 µm, > 40 bands, tunable etalon staring system | Field spectrometer systems | www.psicorp.com |
| ProVision Technologies, Stennis Space Center, MS USA | FPS-RDACS/H3 | 430-920 nm, < 1024 bands prism grating scan mirror pushbroom | Laboratory and industrial applications | www.pvtech.org |
| Solid State Scientific Corp. Hollis, NH USA | CTHIS | 400-900 nm, 64 bands, 2.7-5.0 µm, 64 bands, 8-10.5 µm, 24 bands, chromotomographic staring system | Field or laboratory system | www.solidstatescientific.com |
| Surface Optics San Diego, CA USA | SOC700-V SOC700-NIR | 400-900 nm, 240 bands, 900-1700 nm, 128 bands, | Laboratory, industrial and field applications | www.surfaceoptics.com |
The future
Increasing availability of commercial systems continues to expand the use of hyperspectral imagery. But one reason widespread application has not occurred is the lack of operationally reliable data sources. This is particularly true for the land and coastal remote sensing communities that use regular, repeat-coverage multispectral imagery from the Landsat series of satellites. While Hyperion demonstrated the potential, formal plans are still awaited for an operational land-imaging satellite carrying a true hyperspectral imaging system.
Another hurdle to widespread implementation is the lack of robust automated analysis algorithms. These are sorely needed as the analysis of hyperspectral imagery remains largely the domain of highly trained specialists. Despite many efforts aimed at developing automated processing techniques, robust turnkey solutions have not arrived, with few exceptions. The natural variability and confusing factors in environmental scenes have limited the application of laboratory spectroscopic techniques to remotely sensed imagery. Settings with more controllable data-collection environments, such as industrial or biomedical laboratories, have seen greater automation in the analysis of the data.
So, where is the field of hyperspectral imaging headed? A special industry session at the recent SPIE Defense & Security Symposium (Orlando, FL) offered some glimpses into possible paths. The session included presentations by leading professionals in the use of hyperspectral imaging for mineral and coastal water mapping, human tracking and skin monitoring, and even poultry inspection. One message of this session was that, while the cost and size of the systems continue to decrease, image analysis remains the limiting factor across these disciplines.
Regarding the need for a reliable operational hyperspectral land-imaging data source, a variety of organizations around the world continue to propose satellite systems. A special session, “Future of Hyperspectral Imaging from Space,” at the upcoming IEEE IGARSS 2006 (Denver, CO) conference will have presentations on a number of proposed efforts.
Hyperspectral imaging continues to plod along in its development. In many ways it is a technology in search of an application. Although the “killer app” has not emerged in the environmental-monitoring or remote-sensing fields, applications in the industrial or medical fields may offer the best opportunities for widespread adoption of the technology.
REFERENCES
1. J. Schott, Remote Sensing: The Image Chain Approach, 2nd edition, Oxford University Press, New York, NY (2006).
2. M. Descour and E. Dereniak, Applied Optics 34(22) 4817 (August 1, 1995).
3. T. Hoelter and J. Barton, SPIE Proc. Infrared Tech. and Appl. XXIX 5074, 481 (2003).
4. S. Chien et al., IEEE Intelligent Systems 20(3) 16 (May/June 2005).
5. J. Kerekes et al., SPIE Proc. Algorithms and Technologies for Multispectral, Hyperspectral, and Ultraspectral Imagery XII 6233 (May 2006).
6. W. Smith et al., SPIE Proc. Optical Spectroscopic Techniques and Instrumentation for Atmospheric and Space Research III 3756(October 1999).
7. H. Aumann et al., IEEE Trans. Geosci. Remote Sens. 41(2) 253 (February 2003).
8. E. O’Donnell, “Detection and identification of effluent gases using invariant hyperspectral algorithms,” M.S. Thesis, Chester F. Carlson Center for Imaging Science, Rochester Institute of Technology, Rochester, NY (2005).
9. N. Subramanian et al., Physics of Medical Imaging 6142 (March 2006).
10. X. Gao et al., Nature Biotechnology 22(8) (August 2004).
John Kerekes is associate professor in the Chester F. Carlson Center for Imaging Science at the Rochester Institute of Technology (RIT), 54 Lomb Memorial Drive, Rochester, NY 14623-5604; e-mail: [email protected]; www.cis.rit.edu.