BEN WELLS
When two photographs are compared, the photo with the highest resolution does not always have the best image quality because the human eye places relatively low value on high resolution, preferring instead images with good contrast at low spatial frequencies. This paradox can be clarified through an understanding of modulation transfer function.
Measuring image quality seems like it ought to be simple. After all, we know what we like when we see it. However, reducing image quality to a single number is a surprisingly complicated task.
When asked what makes a good photograph, most people intuitively say it is the ability to resolve fine detail—in other words, high resolution. The familiar United States Air Force (USAF) chart provides a convenient way to measure the resolution of an optical system.1 The chart contains a series of successively smaller three-bar targets whose size varies over a wide range of spatial frequencies. A target and group number identifies each three-bar pattern, and its spacing can be read from a table.
To assess the performance of a camera, an operator might photograph the chart, and then examine the print with a magnifying glass to find the finest resolvable target. It is acceptable to use a magnifying glass for this task—after all, the goal is to evaluate the quality of the photograph, not the operator’s eyesight. As long as the magnification of the optical system is known, the tabulated USAF spatial frequency can easily be converted to lines/mm at the print.
Here is a handy rule of thumb to remember: if we have 20:20 vision we can just barely resolve a bar target in which each line and space subtends one arc minute. At a typical reading distance of 13.5 inches, this corresponds to a spatial frequency of 10 lines (and the spaces in between) per mm. However, there are two problems with this technique. First, it is subjective. Two different operators can reach very different conclusions about which feature is “resolved.” Second, limiting resolution does not correlate very well with how the human eye perceives image quality.
Subjective operator judgment
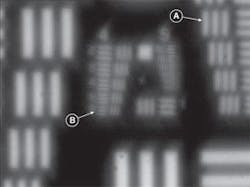
The first question is what we mean by “resolved.” Do we mean that the target should be essentially perfectly reproduced, with high contrast between white and black areas? Or will we accept a situation in which we can just barely tell that there are three lines present? The human eye is capable of detecting contrast differences as small as 1% to 2%, so it is important to specify the level of contrast we require.
Failure to make this clear can lead to misunderstandings. For example, a manufacturer of inexpensive binoculars was required to test each unit for limiting resolution. However, the purchaser (a brand-name distributor) did not specify a contrast value. The result is confusion about what constitutes an acceptable product. In practice, there could be dramatic differences in the opinions of different operators concerning image quality (see Fig. 1). Examples like this are all too familiar to those who have tried to sort products based on USAF resolution testing.
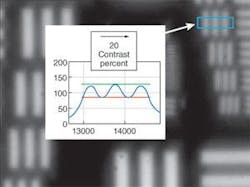
To improve the accuracy and consistency of image-quality measurements, a good first step is to provide the operator with sample images for guidance. If more precision is necessary, it is possible to use an instrument to measure the contrast between white and black areas and set a numeric threshold. The standard industry definition for contrast is (Imax - Imin) / (Imax + Imin), where Imax and Imin are the maximum and minimum intensity values, respectively, taken from inside the target area of the image (see Fig. 2).Image quality and limiting resolution
By definition, limiting resolution ignores everything except the finest detail present in an image. However, studies have shown that the human eye places relatively little value on limiting resolution per se, and instead equates good image quality with good contrast at relatively low spatial frequencies.2 At a typical reading distance of 13.5 in., our eyes are capable of resolving up to 10 lines/mm. Yet we are satisfied with a picture if spatial frequencies up to 2 lines/mm have good contrast.
As an illustration, consider a typical laptop computer with 1024 pixels in the horizontal direction. The LCD screen could display a maximum of 512 lines and spaces in between. If the display is 12 in. wide, the 512 lines correspond to a spatial frequency of 1.7 lines/mm. This is rather low resolution, yet we are generally happy with the image. This observation suggests that limiting resolution is not a very good way to characterize image quality. Instead, we need to look at the performance of our optical system over a range of spatial frequencies. In response to this need, the modulation transfer function (MTF) was developed. In an MTF plot, contrast is plotted against spatial frequency to give a complete picture of the performance of the lens. Technically, it is irrational to speak of the MTF of an image—if the image lacks contrast and sharp edges, it may simply mean the original scene was soft and fuzzy. However, if the original scene contains a target with known characteristics, then we can calculate and plot the MTF of the system that created the image.
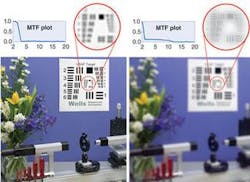
The usefulness of MTF plots lies in their ability to explain why images are pleasing to the eye (see Fig. 3). When we consider the corresponding MTF plots from two photos, we find one with excellent contrast at low spatial frequencies, but no detail beyond 2 lines/mm. The result is a pleasing picture. The other picture, which appears fuzzy to the viewer, contains detail to 10 lines/mm (higher resolution), albeit with poor contrast. The eye evaluates this photo as unsatisfactory because contrast is poor at the crucial low spatial frequencies.MTF measurement
To measure MTF, an operator could theoretically photograph the USAF chart, measure the contrast for a range of targets, and plot the measured contrast versus the spatial frequency of the targets. This method, although possible, is tremendously time consuming. There is also a more subtle problem: the targets are sharp rectangular bars instead of sinusoids. Therefore, each target not only represents a fundamental spatial frequency, but also higher harmonics. This small difference has a measurable effect on the MTF curve, requiring a correction method.3, 4
Another approach is to compute the MTF from the image of a very small pinhole. Such an image is referred to as the “point spread function.” Unfortunately, a very small pinhole must be used, which limits the amount of light. If the signal value is too low, noise may lead to inaccurate measurements.
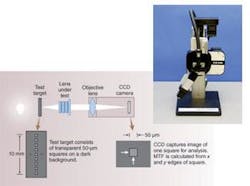
The preferred method is to compute the MTF from the image of a very narrow line or an edge. Fully automated commercial equipment used for this purpose can measure MTF at multiple field positions in just a few seconds (see Fig. 4).Subjective quality factor
While an MTF plot captures a lot of information about an imaging system, in pass/fail testing it is desirable to describe the performance of the system with a single figure of merit. Ed Grainger developed the SQF at Eastman Kodak in the 1970s. Grainger wanted a single metric that would correlate with perceived image quality. In his definition, SQF is constructed by suitably weighting the MTF values between 0.5 and 2.0 lines/mm. In somewhat simplified terms, SQF is just the average MTF from 0.5 to 2 cycles per mm.
As consumers become more sophisticated, they are beginning to look critically at the quality of photos taken by their cell phones and inexpensive digital cameras. As we have seen, high resolution (lots of pixels) does not necessarily mean good image quality. Unlike simple tests like limiting resolution, MTF provides the detailed information needed to evaluate the quality of an imaging system. SQF further reduces the two-dimensional information from an MTF plot to a single, simple figure of merit.
REFERENCES
1. R. Fischer et al., Optical System Design, McGraw-Hill, 302 (2000).
2. E. M. Grainger and K. N. Cupery, Photographic Science and Engineering 16(3) 221 (1972).
3. K. Biedermann and Y. Feng, Proc. SPIE 549, 36 (1985).
4. G. D. Boreman, SPIE Press, Tutorial Texts in Optical Engineering TT52 (2001).


