Spectral data adds a new dimension to remote imaging of Earth
Major advances in detector technology and in the ability to process large amounts of spectrometer data have resulted in imaging spectrometers that allow scientists to "see" the condition of materials and to monitor processes.
Remote sensing of Earth from overhead is rapidly taking on a new dimension as data from imaging spectrometers becomes more widely available. The spectral dimension has been used for more than half a century as the three bands available from color film have evolved to handfuls of multispectral bands that use the spectral properties of Earth to improve target detection and land-cover mapping. A full treatment of the spectral dimension, however, awaited the introduction of imaging spectrometers.

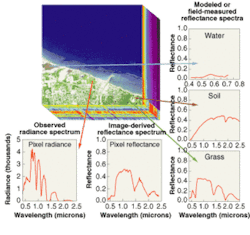
These devices represent the world in three dimensions (3-D; see Fig. 1). Two dimensions represent the spatial brightness variations on Earth's surface that form a conventional image. The third dimension—wavelength—represents a sampling of the spectral radiance reaching the sensor at each pixel. What differentiates an imaging spectrometer from a multispectral sensor is the large number of contiguous spectral samples in a spectrometer. A typical instrument flying today has tens to hundreds of bands, with 10-nm bandwidth, on 10-nm centers in the reflective spectral region (400 to 2500 nm). There are also spectrometers operating in the thermal IR windows (3 to 5 µm and 8 to 14 µm) with tens to hundreds of bands per window.
Imaging spectroscopy for Earth observation was demonstrated as early as 1984 by NASA's Airborne Imaging Spectrometer (AIS). This demonstration test bed was a pushbroom spectrometer generating images 32 pixels wide and 128 bands deep along a flight line (see Fig. 2, left).1 It was motivated by the potential to use spectral variability to perform detailed assessment of the composition of Earth's surface. Chemists have been using transmission spectroscopy for decades to perform chemical analysis of fluids and thin sections of solids. The goal of remote imaging spectroscopy is to apply similar approaches to reflection or emission spectra.

In practice, remote spectroscopy offers significant challenges. Reflection spectra are dominated by surface effects and scattering phenomena that can soften spectral signatures. The source strength is controlled by sunlight in the reflective region and target temperature in the emissive region and can't easily be turned up to increase signal levels. Furthermore, the atmosphere contaminates the spectra by adding transmissive absorption features and flare light. Finally, to maintain the signal-to-noise ratio the spectral samples are typically of spot sizes (pixels) on Earth such that many features are sampled at once (so materials are mixed in the pixel).
Despite these limitations and the fact that the 32-pixel swath made the AIS instrument barely an imager by imaging standards, this early instrument clearly demonstrated the potential of remote imaging spectroscopy. Operating in the near-IR, it was able to differentiate and map spatial patterns in geologic features. To grow the AIS design spatially, spectrally, and radiometrically (that is, to improve signal-to-noise) required major advances in detector technology including larger arrays, arrays with more spectral range, and significant improvements in the signal-to-noise ratio. Sensor designers have used alternate designs and dramatic improvements in detector technology to reach the current state of the art with many hundreds of cross-track pixels and hundreds of spectral bands.
Alternative designs
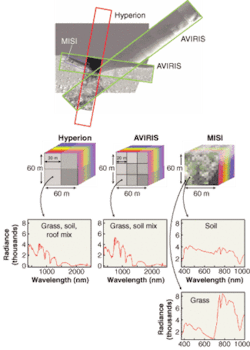
The Advanced Visible-Infrared Imaging Spectrometer (AVIRIS)—NASA's airborne test/demonstration instrument—represents one alternative design. The AVIRIS is a line-scanning spectrometer that uses four separate monochromators and linear arrays to cover the 400- to 2500-nm range in 224 spectral bands (see Fig. 2, right).2 When flown at 60,000 ft, AVIRIS generates more than 600 cross-track pixels, 20 m each on a side (see Fig. 3). The AVIRIS instrument reflects the advances in the detector/microelectronic field over the past two decades. While maintaining essentially the same optomechanical design, several detector and electronic upgrades during this period have improved the AVIRIS signal-to-noise ratio by approximately twentyfold to more than 1000 for a 50% reflector.3
The HYDICE instrument developed by the U.S. Navy in the early 1990s demonstrated major advances in two-dimensional (2-D) detector technology that have spurred continued widespread use of pushbroom instruments. The HYDICE demonstrated the use of 2-D focal-plane arrays that span from 400 to 2500 nm in a single detector array.4 In the past decade these advances have enabled development and deployment of several airborne imaging spectrometers including instruments operating in the thermal IR.5
The Moderate Resolution Imaging Spectrometer (MODIS) launched on the TERRA spacecraft in 1999 represents a transition instrument to space-based spectroscopy.6 Its 36 spectral bands spread from 0.4 to 13 µm make it more of a multispectral instrument than a true spectrometer. Nevertheless, its daily global coverage (twice daily with the launch of a second MODIS instrument on the Aqua spacecraft) at 1-km spatial resolution represents the only data for many sites.
The Hyperion instrument launched on the EO-1 research test bed represents the first readily available data from space.7 Hyperion is a pushbroom instrument with a 7.5-km-wide ground track, a 30-m spatial resolution and 220 spectral bands from 400 to 2500 nm (see Fig. 3).
Processing spectrometer data
The advances in sensor technology that led to the wide array of spectral-sensor data available today have been spurred by concurrent advances in computer processing, data storage, and data transmission (network bandwidth). The movement, storage, and processing of modern imaging spectrometer data (a single AVIRIS flight line can be 5 GByte) would not be practical without these advances. In the past, increasing the spectral dimension was plagued with the "curse of dimensionality." The incremental information came at too high a cost in bandwidth, archival storage, and processing time to make it practical. Given today's computational environment, advanced processing algorithms are being developed that attempt to exploit every bit of information made available by the increased spectral dimensionality. In fact, turning the "curse" into a "blessing" is at the forefront of today's remote-sensing research.
Consider, for example, the problem of atmospheric compensation that has always plagued the remote-sensing community. To directly relate the sensor reaching spectral radiance to laboratory or field measurements we need to invert the radiance data to engineering units in the form of spectral reflectance or spectral emissivity. This involves calculating the magnitude of the atmospheric transmission, upwelled radiance, and downwelled radiance that have impacted the observed radiance. Typically, this meant using some source of ground truth or one of several tricks depending on scene content to attempt to generate what is usually an image-wide estimate of the atmospheric terms.
These methods often require human intervention and can leave substantial errors.8 Spectral-image data includes the impact of the atmosphere on each pixel spectrum in sufficient detail to characterize dominant atmospheric effects on a per-pixel or local-window (5 × 5-pixel window, for example) basis—such as by comparing the observed structure of the 940-nm water-vapor-absorption feature in a handful of spectral channels around 940 nm to a radiative transfer (RT) model of the atmosphere that predicts the spectrum. This allows the amount of water vapor in the atmosphere to be computed. Similar computations yield estimates of the atmospheric aerosol amounts that, when coupled with the RT models, generate not only per-pixel estimates of diffuse spectral reflectance but also image-wide maps of column water vapor and aerosol number density in the atmosphere.
Remotely sensed multispectral data has been used to map the Earth's surface into broad general categories using per-pixel classification (forest, agriculture, and desert for instance) and in some cases into limited subcategories, such as conifer and deciduous forest. The detail available from spectral data allows mapping not only to finer classification levels but also to subpixel levels. For example, an observed reflectance spectrum can be unmixed into the specific fractions of the spectra of green vegetation, nonphotosynthetic vegetation, and soil that are required to produce the observation. This results in fraction maps showing the subpixel fraction of each spectral basis vector that is present in each pixel. These fraction maps can help better understand subtle variations in vegetation communities or to map fuel potential in fire-prone areas.
The concept of subpixel abundance mapping comes into play in a wide variety of spectral-analysis algorithms. Many of these algorithms, while varying considerably in their specifics and their application, are showing considerable success in detecting and mapping the presence of materials even at small fractions of a pixel based on the spectral influence of the material on the observed spectrum. Applications include mineral mapping, forestry, agriculture, wetlands, range management, and defense/intelligence. In all these fields, imaging spectroscopy is allowing us to detect and map at the subpixel level many more materials than were previously possible. The importance of this is not just the increased numbers of materials, nor the detail of the maps—though these improvements alone are considerable.
In addition to the general mapping function, imaging spectroscopy is increasingly allowing scientist to "see" the condition of materials and to monitor processes. The amount of liquid water in vegetation, for example, can be mapped to monitor irrigation need, drought damage, and fire fuel loadings.9
Additional innovative applications of spectroscopic imaging are likely. The ongoing rapid advances in sensor technology, processing power, and algorithmic approaches suggest that today's advances are just the start of an exciting era in spectroscopic imaging of the Earth.
REFERENCES
- G. Vane, A.F.H. Goetz, J.B Wellman, IEEE GeoScience and Remote Sensing, GE 22(6) 546 (1984).
- G. Vane, A. F. H. Goetz, Remote Sensing of Environment 24, 1 (1988).
- R. O. Green, J. E. Conel, D.A. Roberts, Proc. SPIE, Imaging Spectrometry of the Terrestrial Environment. 1937, 2 (1993).
- L. J. Rickard, Proc. SPIE, Imaging Spectrometry of the Terrestrial Environment 1937, 173 (1993).
- J. A. Hackwell et al., Proc. SPIE 2819, 102 (1996) and P. G. Lucey et al., Proc. SPIE 4132, 186 (2000).
- W.L. Barnes, Proc. SPIE 5151, 337 (2003).
- J. Pearlman, Proc. SPIE 4135, 243 (2000).
- J. R. Schott, Remote Sensing: The Image Chain Approach, Oxford University Press (1997).
- B. Gao, Remote Sensing of Environment 58(3) 257 (1996).
FURTHER READING
R.V. Raqueño et al., Proc. AVIRIS Earth Science and Application Workshop, Feb. 2000, http://aviris.jpl.nasa.gov.
SPIE Proc. on Imaging Spectroscopy, www.spie.org.
JOHN SCHOTT is a professor of imaging science at Rochester Institute of Technology, 54 Lomb Memorial Dr., Rochester, NY 14623; e-mail: [email protected].