Knowing the math aids measurement of polarization
THOMAS F. DROUILLARD II and PAUL A. SEARCY
Several state-of-polarization (SOP) measurement techniques are commonly used in modern polarimetric instrumentation. To aid in understanding polarization and its measurement, an explanation of SOP is helpful, along with an outline of common polarimetry technologies. One of these measurement approaches, an emerging technology that uses liquid-crystal variable retarders, has no moving parts and is similar in accuracy and precision to moving mechanical systems.
What is being measured
An important property of light is polarization, which is the direction of the electric-field vector of an optical-wave orthogonal to the propagation direction. The significant aspects of polarization are the magnitudes of the x- and y-directed electric-field components and the relative phase φ (z-directed offset) between them.
Several specific arrangements of the electric-field components exist. For instance, when the electric field is completely x or y directed, the polarization is respectively horizontal or vertical and the polarization state is linear. A more general instance of linear polarization occurs when the relative phase φ = 0.
Another distinctive instance occurs when the relative phase between the x and y components is one quarter of the wavelength of the light wave and the components are equal in magnitude. This configuration is circular polarization. The sign of the phase difference determines the handedness and rotation direction, which refers to the precession of the electric-field vector in a plane through which a circularly polarized light wave passes. Right-hand circular polarization rotates clockwise and left-hand circular polarization rotates counterclockwise, as "viewed" by an observer looking toward the approaching beam.
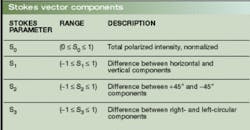
A brief description of the general SOP and its notation will aid those intending to delve into its measurement. The SOP is a mathematical construct that uses any of several vector conventions to completely describe the electric-field components of a light wave. The Stokes formalism is a four-component vector expressed in one form as S = [S0, S1, S2, S3] (see table).
The intensity is S0 and is typically normalized to 1; it provides a reference by which the degree of polarization (DOP) is quantified. The DOP is the result of adding S1, S2, and S3 in quadrature. When this quantity equals S0, then the light wave is said to be completely polarized, while a DOP of less than 1 indicates partial polarization. Strictly speaking, all light is polarized, since the electric-field components must point somewhere. That assertion, however, refers to the instantaneous SOP of light; partial polarization is indicated if the SOP varies irregularly over a spatial, temporal, or spectral region of interest.
The horizontal/vertical component of an SOP is quantified by S1; an S1 of 1 indicates horizontal linearly polarized light, while an S1 of -1 indicates vertical linearly polarized light. The measure of the diagonal orientation of the SOP is S2; when S2 is +1 or -1, it indicates +45° or -45° linear polarization, respectively. The measure of the nonlinear characteristic of the SOP is S3; when S3 is +1 or -1 it denotes right- or left-circular light, respectively. These extreme values of S1, S2, and S3 are the so-called eigenstates of polarization.
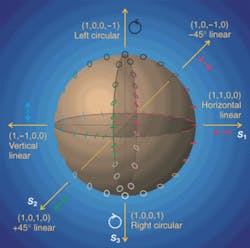
An example demonstrates the uniqueness of the eigenstates. In considering a smooth path from horizontal (S1 = 1) to vertical (S1 = -1) polarization, one must consider how S1 is changed: is the linear state smoothly rotated, or is the phase difference smoothly increased? The midpoint of the path occurs at S1 = 0, so what becomes of the SOP at the midpoint? As S1 approaches zero, the SOP will either become diagonal (S2 approaches 1 or -1 as S3 remains zero), or circular (S3 approaches 1 or -1 as S2 remains zero), or a combination of these two extremes occurs (|S2| and |S3| approach maxima, each less than 1; see Fig. 1).Graphically rendering the SOP
In addition to mathematically expressing the SOP by a Stokes vector, it is convenient to render the SOP graphically. Two prevalent conventions for plotting the SOP are the polarization ellipse and the Poincaré sphere. The polarization ellipse is a trace of the electric field in a plane perpendicular to the propagation direction of the light wave, looking toward the source. The ellipticity (the girth of the polarization ellipse) relates to the phase between the x and y components, and the azimuth (angle of the major axis) relates to the relative magnitudes of the x and y components. The polarization ellipse representing a linear SOP is one in which the ellipticity is zero; the ellipse collapses to a line at the angle of the linear polarization. Conversely, a circular state is rendered as a circle (ellipticity of 1). In the case of ideally circular polarization, the azimuth of the polarization ellipse becomes ambiguous, reflecting the physical symmetry of circularly polarized light. A drawback to the polarization ellipse as a plotting convention is that the handedness of a nonlinear SOP is not clarified.
The Poincaré sphere is a graphical rendering of a Stokes vector in a spherical coordinate space (see Fig. 2). The radius of the sphere represents the S0 parameter, and will therefore be unity in this discussion (recall that an S0 of less than 1 indicates depolarized light). Linear polarization states lie in the equatorial plane defined by the S1 and S2 axes. The S3 axis represents circular polarization and is perpendicular to the equatorial plane. Referring back to the example of changing the SOP smoothly from horizontal to vertical, these two cases represent two paths on the surface of the sphere—one along the equator through the S2 axis, and the other a longitudinal path through one of the S3 poles.Polarization optics
Polarization optics generally affect either the relative magnitudes of perpendicular components or the phase between perpendicular components. Under the former category are dichroic polarizers and prism polarizers. Dichroic polarizers use a material that transmits one component and absorbs or reflects the perpendicular component; this is known as diattenuation. Prism polarizers redirect orthogonally polarized components in different spatial directions.
Polarization optics that affect the phase between orthogonal components are called retarders or waveplates. The material basis of a retarder is birefringence: one component of a light wave sees a different index of refraction (and thus has a different optical-path length through the material) than the perpendicular component. Commercially available waveplates are specified by the amount of retardance at a particular wavelength and the fast-axis location (the transverse angle at which the index of refraction is minimum).
Reflections at non-normal incidence also produce phase shifts between orthogonal components of the incident light. A component that utilizes this effect is the Fresnel rhomb. Light enters the rhomb, undergoes two internal reflections that result in a 90° phase shift, then exits.
Variable retarders are also available; these commonly consist of a liquid-crystal cell that changes retardance according to an applied voltage signal. Specifically, a liquid-crystal cell with no voltage applied acts as a retarder, with a retardance proportional to the liquid-crystal thickness and birefringence. Application of a voltage causes the liquid-crystal molecules to align to the electric field (parallel to the direction of light propagation), thereby reducing (or nullifying with sufficient voltage) the birefringence of the cell.
Polarization metrology
Several polarimetry techniques are implemented in commercial devices. A simple approach is to configure the appropriate polarization optics to divide a light wave into Stokes components and measure each component separately. This technique is prone to significant uncertainty due to unmatched and possibly drifting .photodetector gains.
The SOP can also be measured by directing a light wave through a series of waveplates in which one is mechanically rotating at high speed, then through a polarizer and onto a detector. The Stokes parameters can be resolved from the time-varying signal. Uncertainties in this single-detector approach are significantly reduced from the four-detector configuration due to the reduction of 1/f noise by the AC detection scheme. Uncertainty in this type of polarimeter is generally attributed to the mechanics of the rotating waveplate.
Liquid-crystal polarimetry
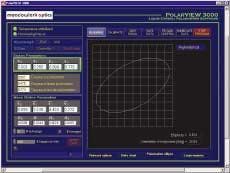
A new solid-state approach is to replace the rotating waveplates with liquid-crystal variable retarders (LCVRs; see Fig. 3). A polarimeter based on LCVR technology is slower than its rotating-waveplate counterpart, and liquid-crystal cells require tight control of temperature, but LCVRs otherwise offer a technology that is unencumbered by the pitfalls of a mechanical system with comparable precision and accuracy.In an LCVR, calibration and measurement use the same detection technique: light passes through two LCVRs, then through a polarizing beam cube, and finally onto a detector. Starting with both LCVRs at a maximum retardance (on the order of one to two waves), the first LCVR is varied from maximum to zero retardance, and then the second LCVR is varied to zero retardance. As the retardances change, a time-varying intensity signal lands on the photodetector. The polarimeter electronics sample and store the detected signal.
Calibration requires the ability to produce the six eigenstates of polarization as inputs to the polarimeter. One method that can be used to produce these states is to rotate a linear polarizer to produce the four linear states, then use a polarizer followed by a quarter-wave retarder to produce the circular states. At least one device to simplify this procedure by use of kinematic mounts is commercially available.
The time-varying intensity signals resulting from each eigenstate characterize the response of the polarimeter. When light having an arbitrary SOP is detected with a calibrated polarimeter, the signal is recorded, and the four Stokes parameters are calculated from the characteristic signals.
Thomas F. Drouillard II is a senior photonics engineer and Paul A. Searcy is a senior optical engineer at Meadowlark Optics, Inc., P.O. Box 1000, Frederick, CO 80530; e-mail: [email protected].


